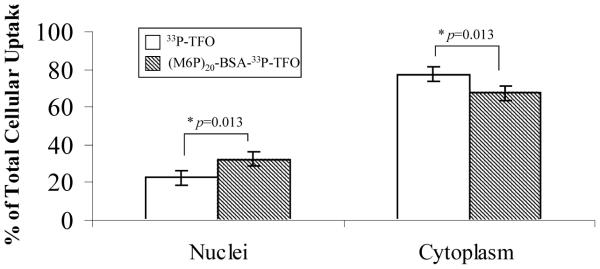
FIGURE 2.
Subcellular distribution of (M6P)20-BSA-33P-TFO and 33P-TFO in HSC-T6 cells at 4 h post-incubation at 37 °C. Cells were harvested and the nuclei were isolated from the cytoplasm using Nuclei EZ PREP nuclei isolation kit (Sigma, St Louis, MO). The subcellular distribution was expressed as % of total cellular uptake and values are mean ± SD of 3 independent experiments. Asterisk: statistically significant.

