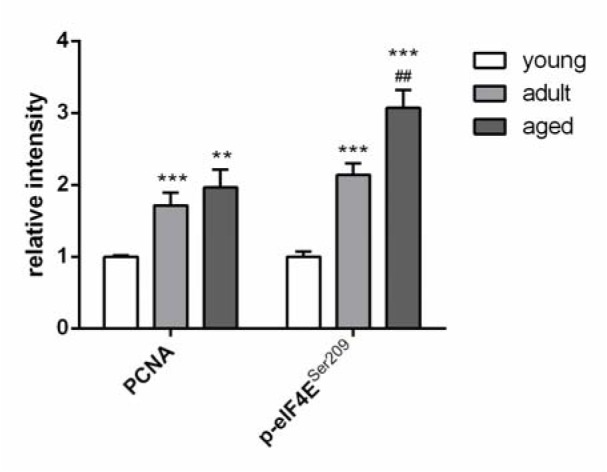
Figure 6. Protein expression of two different proliferation markers determined by Western Blot. Values are expressed as fold of GAPDH and are mean ± SEM of three rats per age group. Significant differences (determined by Mann Whitney t-test) to the young group (** p<0.01, *** p<0.001) or between adult and aged rats (## p<0.01) are indicated.

