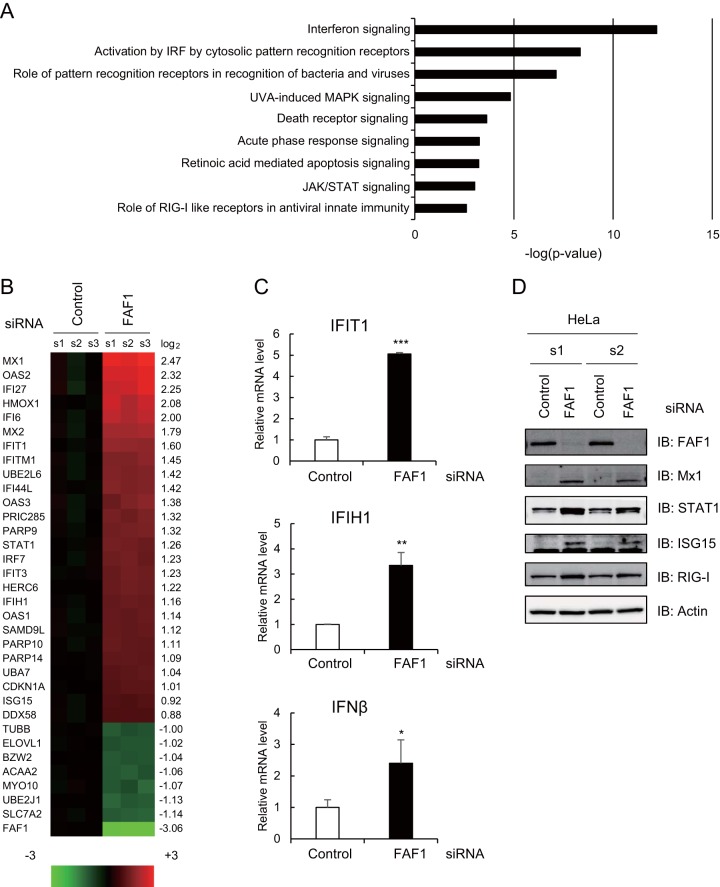
FIG 1.
Effects of knocking down FAF1 on the immune signaling pathway. HeLa cells were transfected with a control or FAF1 siRNA 1. After 48 h, cells were harvested and examined. (A and B) Differentially expressed genes were analyzed using a microarray. Genes (fold change of ≥1.5) were analyzed using Ingenuity Pathway Analysis (IPA), and predicted signaling pathways are listed with their P values (A). Heat maps (B) show microarray analysis results. Genes up- or downregulated more than 2-fold in FAF1-knockdown cells and some representative genes are listed (left side of the heat map) with their log2 ratios (right side of the heat map). Columns s1, s2, and s3 indicate biological triplicates of the experiment. (C) mRNA levels of IFIT1, IFIH1, and IFN-β were measured using RT-qPCR. The values were normalized to GAPDH mRNA values and represent the means ± standard deviations of three experiments. (D) Protein levels of FAF1, Mx1, STAT1, ISG15, and RIG-I were analyzed using Western blot analysis. Actin bands are shown as loading controls. s1 and s2 indicate biological duplicates of the experiment. IB, immunoblot.

