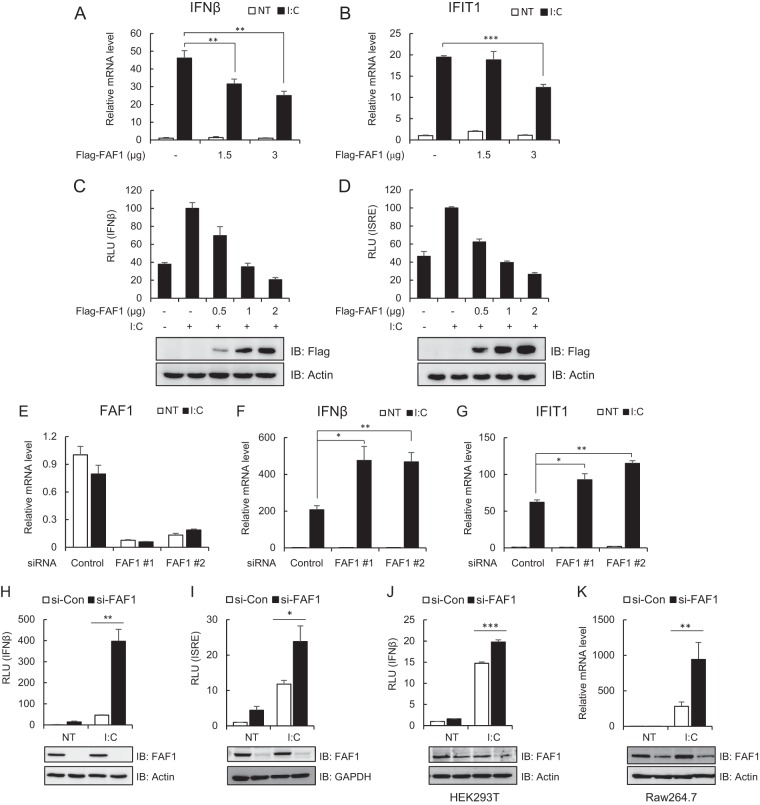
FIG 2.
FAF1 inhibits poly(I·C)-induced IFN-β activation. (A and B) HeLa cells were transfected with the indicated amount of Flag-FAF1 plasmid. After 24 h, cells were treated with poly(I·C) (I·C; 10 μg/ml) by transfection for 8 h. mRNA levels of IFN-β and IFIT1 were measured using RT-qPCR. The values were normalized to the value for GAPDH mRNA and represent the means ± standard deviations of three experiments. **, P < 0.01; ***, P < 0.001 (for differences between Flag and Flag-FAF1 values). NT, not treated. (C and D) HeLa cells were cotransfected with the indicated amount of Flag-FAF1 plasmid and IFN-β-Luc (C) or ISRE-Luc (D) together with a beta-Gal reporter plasmid. After 24 h, cells were treated with poly(I·C) (10 μg/ml) by transfection for 8 h, and relative luciferase activities were measured. The data represent the means ± standard deviations of triplicate experiments. Overexpressed Flag-FAF1 is shown by Western blotting, with actin bands representing loading controls. RLU, relative light units. (E to G) HeLa cells were transfected with two kinds of FAF1 siRNAs, 1 and 2. After 40 h, cells were treated with poly(I·C) (10 μg/ml) by transfection for 8 h. mRNA levels of FAF1, IFN-β, and IFIT1 were measured using RT-qPCR. The values were normalized to the value for GAPDH mRNA. (H and I) HeLa cells were transfected with FAF1 siRNA 2, and 72 h later, cells were transfected with IFN-β-Luc (H) or ISRE-Luc (I) together with a beta-Gal reporter plasmid. Cells were treated with poly(I·C) (10 μg/ml) by transfection for 9 h, and relative luciferase activities were measured. Knockdown of endogenous FAF1 was shown by Western blotting, with actin bands and GAPDH bands representing loading controls. si-CON, control siRNA; si-FAF1, siRNA targeting FAF1. (J) HEK293T cells were transfected with FAF1 siRNA 2 for 72 h and transfected with IFN-β-Luc together with a beta-Gal reporter plasmid. Then cells were treated with poly(I·C) (10 μg/ml) by transfection for 12 h, and relative luciferase activities were measured. (K) Raw264.7 cells were transfected with FAF1 siRNA 2 for 36 h and treated with poly(I·C) (10 μg/ml) for 12 h. The mRNA level of IFN-β was measured using RT-qPCR. The values were normalized to the value for GAPDH. Knockdown of endogenous FAF1 is shown by Western blotting, with actin bands representing loading controls. All of the data represent the means ± standard deviations of three experiments. *, P < 0.05; **, P < 0.01; ***, P < 0.001 (for differences between control siRNA FAF1 siRNA values).

