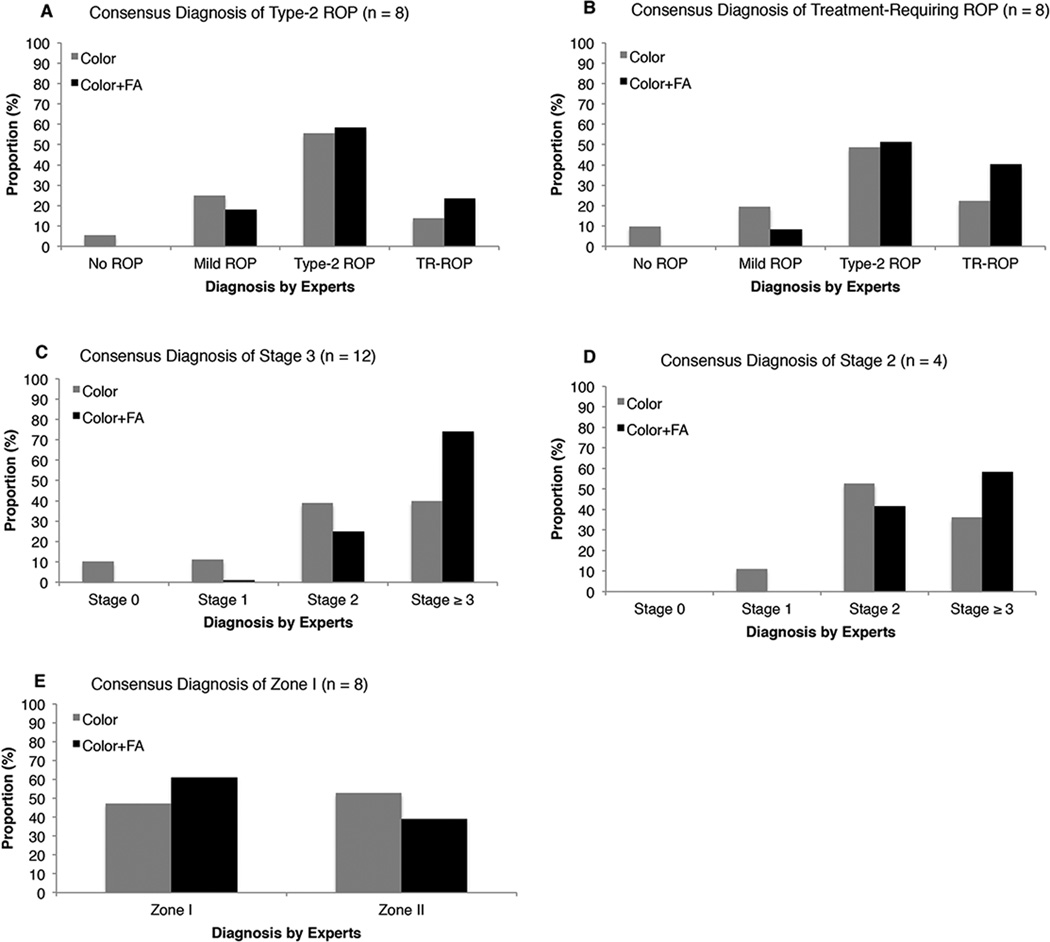
Figure 2. Mean Distribution of Retinopathy of Prematurity (ROP) Diagnosis by 9 ROP Experts using Color Fundus Photographs Only versus Color Fundus Photographs with Corresponding Fluorescein Angiograms (FA).
Gray bars indicate diagnosis using color fundus photographs only and black bars indicate diagnosis using color fundus photographs and corresponding FAs (black bars). A, Distribution of responses for the 8 eyes with a consensus diagnosis of type 2-ROP. B, Distribution of responses for the 8 eyes with a consensus diagnosis of treatment-requiring ROP. C, Distribution of responses for the 12 eyes with a consensus diagnosis of stage 3. D, Distribution of responses for the 4 eyes with a consensus diagnosis of stage 2. E, Distribution of responses for the 8 eyes with a consensus diagnosis of zone I.
ROP = Retinopathy of Prematurity; FA = Fluorescein Angiogram; TR-ROP = Treatment requiring ROP

