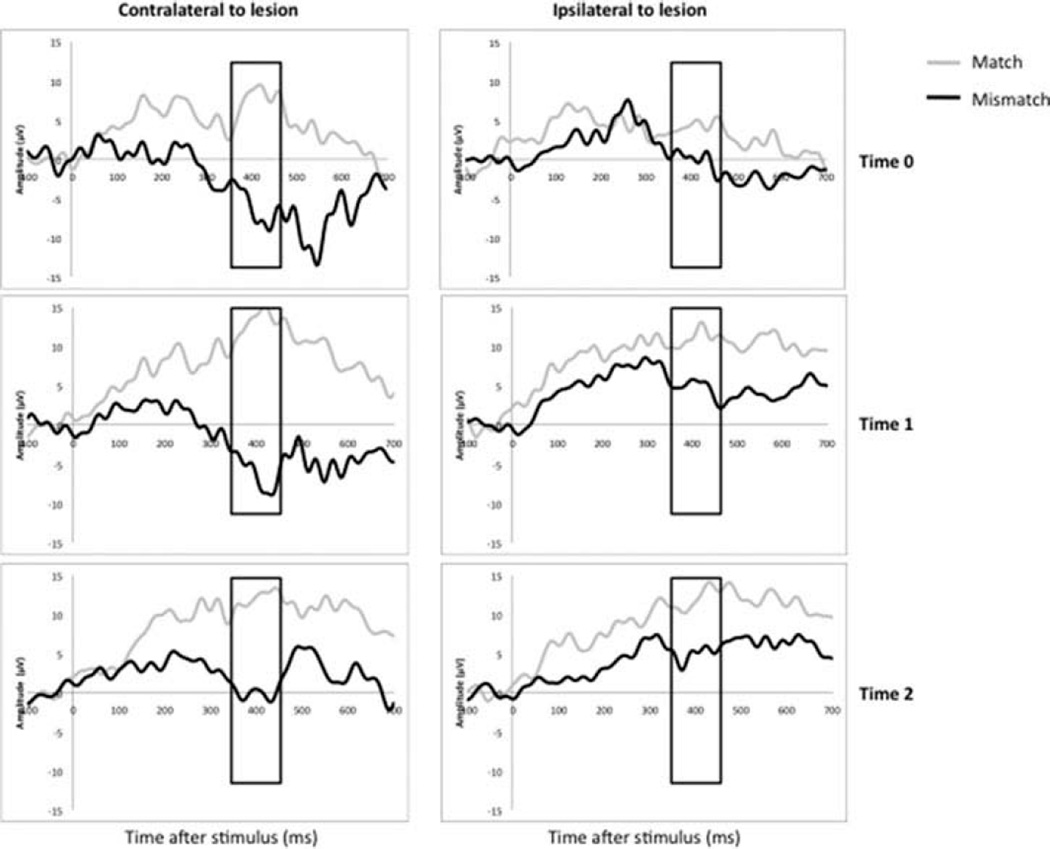
Figure 2.
Differences in picture–word match and mismatch responses in frontal locations in a representative subject. Response to match is traced in grey, mismatch in black. Panels are vertically arranged by Time 0 (baseline), Time 1 (immediately post CIMT), and Time 2 (6 months post CIMT). Panels are arranged horizontally by hemiscalp locations. Time post stimulus in ms is on the x-axis of each panel, mean amplitude in µV on the y-axis. Rectangle in each panel indicates N400 response window.

