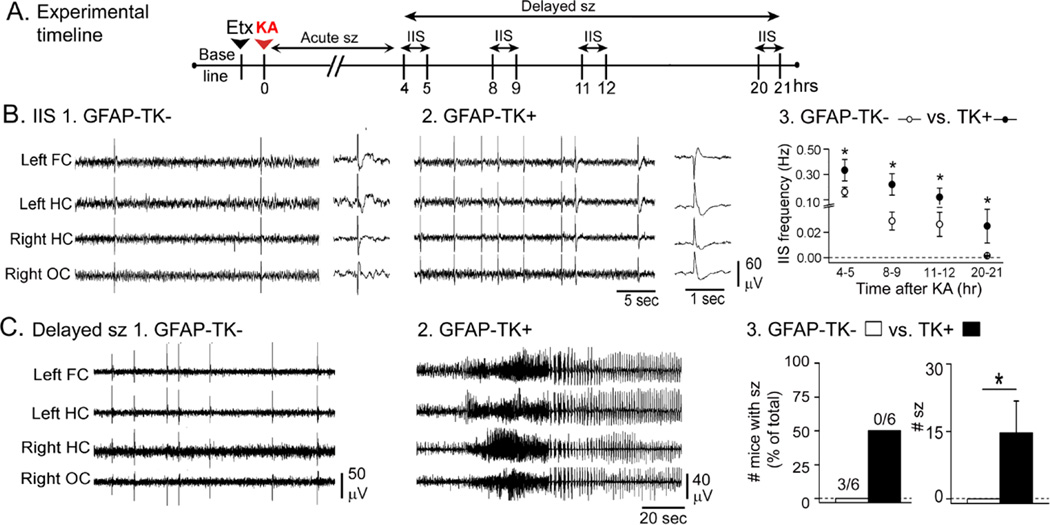
Figure 3. Greater delayed effects of KA in GFAP-TK+ mice compared to GFAP-TK−mice.
A. The experimental timeline is shown. Animals were treated with ethosuximide and 20 mg/kg KA. IIS were analyzed during the 4–21 hrs after KA as shown. Sample sizes are as follows: GFAP-TK−: n = 7; GFAP-TK+: n = 6.
B. Representative examples of IIS from a GFAP-TK− (1) and GFAP-TK+ (2) mouse. For 1–2, the trace to the right shows an IIS at higher temporal resolution. Qualitatively, IIS had similar morphologies. 3. There was a higher IIS frequency in GFAP-TK+ mice compared to GFAP-TK− mice at all the time points tested.
C. 1–2. Representative examples of records from a GFAP-TK− and a GFAP-TK+ mouse at similar delays (approximately 7.5 hrs) after KA.
3. The number of mice with delayed seizures was not significantly greater in GFAP-TK+ mice compared to TK− mice, but the mean number of seizures per mouse was greater in GFAP-TK+ mice.

