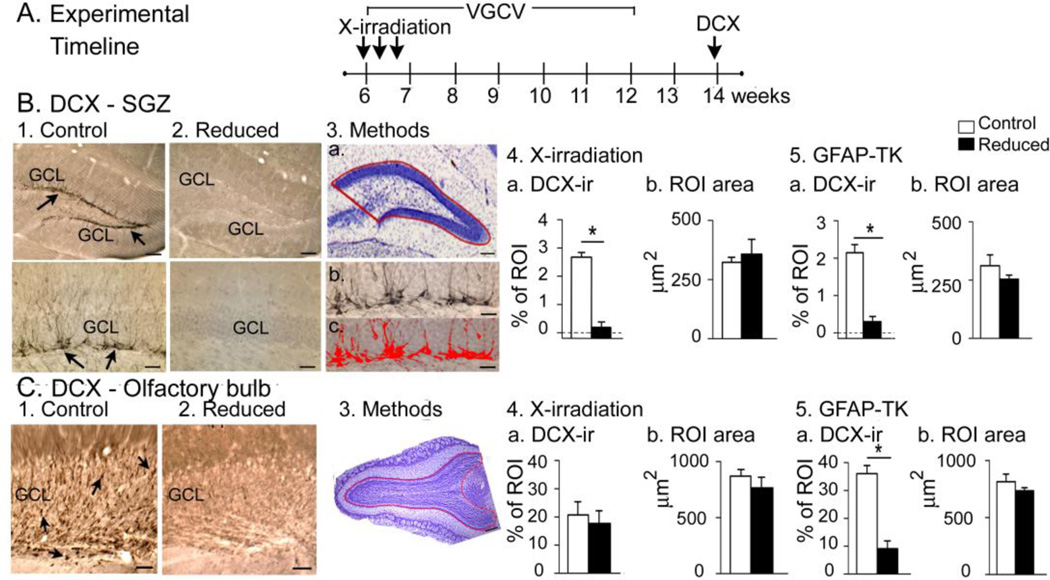
Figure 7. Confirmation of suppression of adult neurogenesis.
A. The experimental timeline used to confirm that adult neurogenesis was suppressed by X-irradiation.
B. 1–2. DCX-ir in a sham (1a–b) and X-irradiated mouse (2a–b) shows strong DCX-ir (arrows) only in the sham. GCL, granule cell layer. Calibrations, 75 µm (1a, 2a); 30 µm (1b, 2b). 3.a. The ROI used to quantify DCX-ir. b-c. DCX-ir before (b) and after thresholding DCX-ir in red (c). Calibration, 75 µm (a); 30 µm (b, c).
4. DCX-ir in X-irradiated mice was negligible compared to sham (Mann-Whitney U-test, p = 0.045; n = 3/group) and there was no difference in ROI area (t-test, p = 0.646).
5. DCX-ir in GFAP-TK+ mice was negligible compared to GFAP-TK− mice (Mann-Whitney U-test, p<0.001; n = 3/group) and there was no difference in ROI area (t-test, p = 0.257.
C. 1–2. DCX-ir (arrows) in the OB was robust in the GFAP-TK− (left) but not GFAP-TK+ mice (right). G, granule cell layer. Calibration, 100 µm.
3. The OB ROI is shown in a cresyl violet-stained section.
4. X-irradiated mice were not significantly different from sham mice in DCX-ir or ROI area (t-tests, p = 0.481, p = 0.694 respectively, n = 3/group).
5. GFAP-TK+ mice had a negligible DCX-ir relative to GFAP-TK− mice but no differences in ROI area (t-tests, p<0.001, p = 0.299 respectively, n = 3/group).

