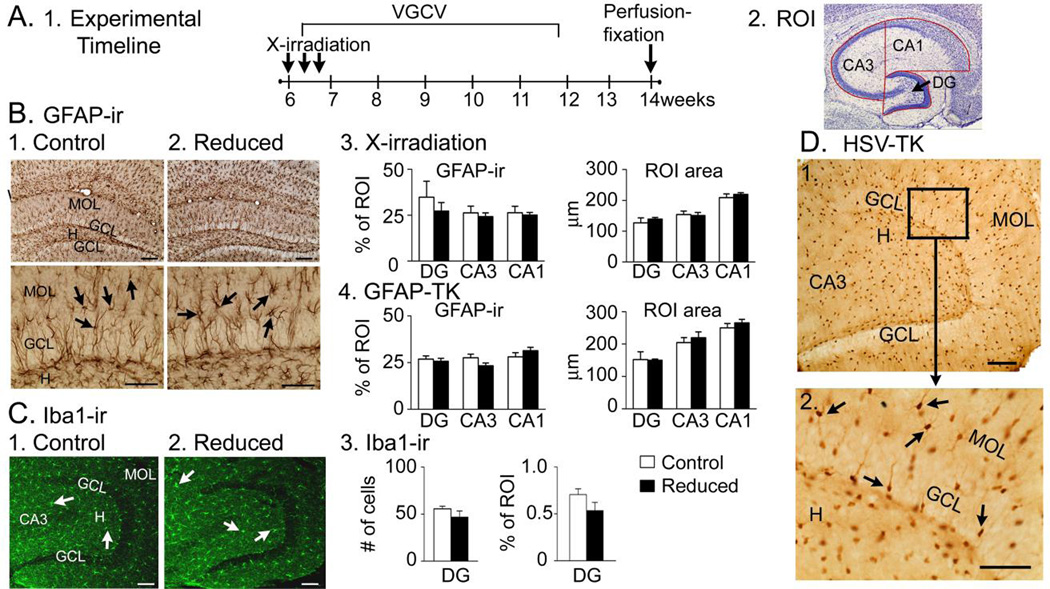
Figure 8. Specificity of GFAP-TK+ mice.
A. 1. The experimental timeline is shown.
2. The ROIs used to examine the DG, CA1 and CA3 are shown.
B. 1–2. GFAP-ir was similar in mice with normal and reduced adult neurogenesis. Arrows point to GFAP-ir cells. Calibration (Top), 100 µm; (Bottom), 75 µm.
3. There were no differences in GFAP-ir in sham- and X-irradiated mice (DG, CA1, CA3: t-tests, p = 0.488, 0.652, 0.750 respectively, n = 3/group) or ROI area (t-tests, p = 0.519, 0.841, 0.521, n = 3/group).
4. Differences in GFAP-ir were not detected in comparisons of GFAP-TK− and GFAP-TK+ mice (t-tests, p = 0.633, 0.0848, 0.2603 respectively, n = 3/group) or ROI area (t-tests, p = 0.623, 0.545, 0.380 respectively, n = 3/group).
C. 1–2. Iba 1-ir (arrows) was similar in GFAP-TK− (1) and GFAP-TK+ (2) mice. Calibrations, 100 µm.
3. Mice with reduced adult neurogenesis were not different from controls in Iba 1-ir in the DG (t-test, p = 0.194, n = 3/group) or the DG ROI area (t-test, p = 0.763, n = 3/group).
D. Top: A representative section from a GFAP-TK+ mouse stained with an antibody to hsv-TK shows numerous cells in the DG with the morphology of astrocytes (arrows). Calibration, 100 µm.
Bottom: The area surrounded by the box is expanded. Calibration, 100 µm.

