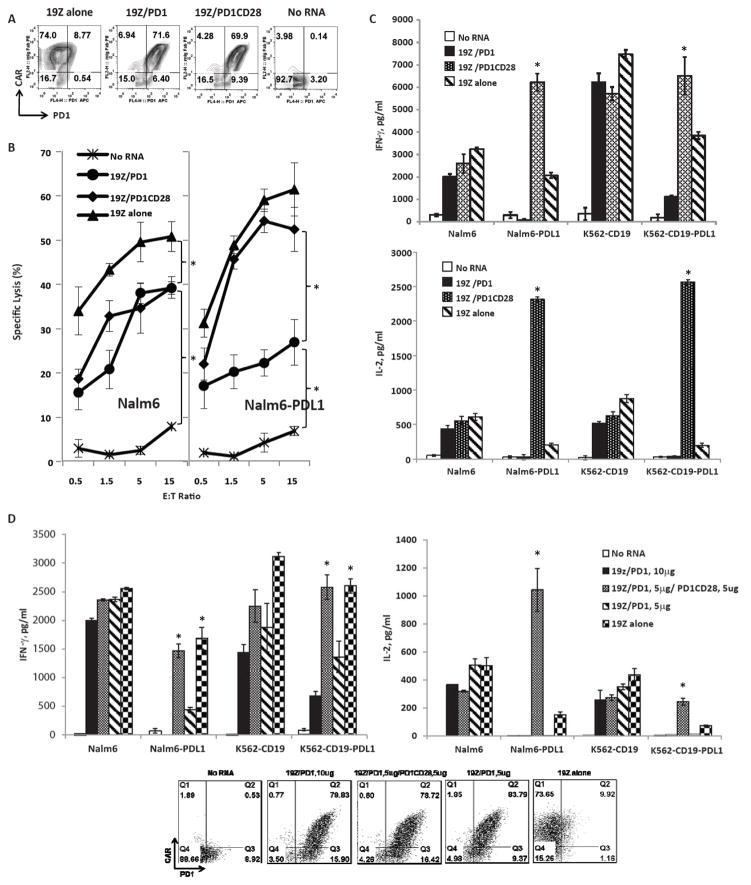
Figure 1. Increased cytokine production of T-cells co-expressing 19Z CAR and PD1CD28 switch-receptor via mRNA electroporation.
FACS analysis of T-cells one day after electroporation with no mRNA; or mRNA for CD19-zeta alone (19Z alone), co-electroporated with CD19-zeta and PD1 (19Z/PD1) or CD19-zeta and PD1CD28 switch-receptor (19Z/PD1CD28). The CAR expression was detected using an anti-mouse IgG Fab antibody, PD1 or PD1CD28 were detected with anti-PD1 antibody. (A). T-cells were tested for their cytolytic activity at indicated E:T ratios for 8hr against Nalm6 (left) or Nalm6-PDL1 (right). The results shown are the averages of three independent experiments (B). The T-cells were also co-cultured with indicated tumor cell lines for 24h for ELISA cytokine secretion measurement in culture supernatants. Bar graphs show results from a representative experiment (values represent the average ± SE of triplicates) for IFNγ (upper panel) and IL-2 (lower panel) (C). T-cells were co-electroporated with 10ug 19Z mRNA and 5ug PD1 mRNA (19Z/PD1, 5ug), with 5ug PD1CD28 mRNA (19Z/PD1, 5ug/PD1CD28) or 5ug PD1 (19Z/PD1, 10ug) as indicated. 19z alone and no RNA served as controls. One day after the electroporation, the T-cells were analyzed by FACS to confirm expression (D, dot plots) and were co-cultured with indicated tumor cell lines for 24h. Cytokine secretion was measured by ELISA analysis of culture supernatants. Bar graph show results from a representative experiment (values represent the average ± SD of triplicates) for IFNγ (left panel) and IL-2 (right panel) (D).

