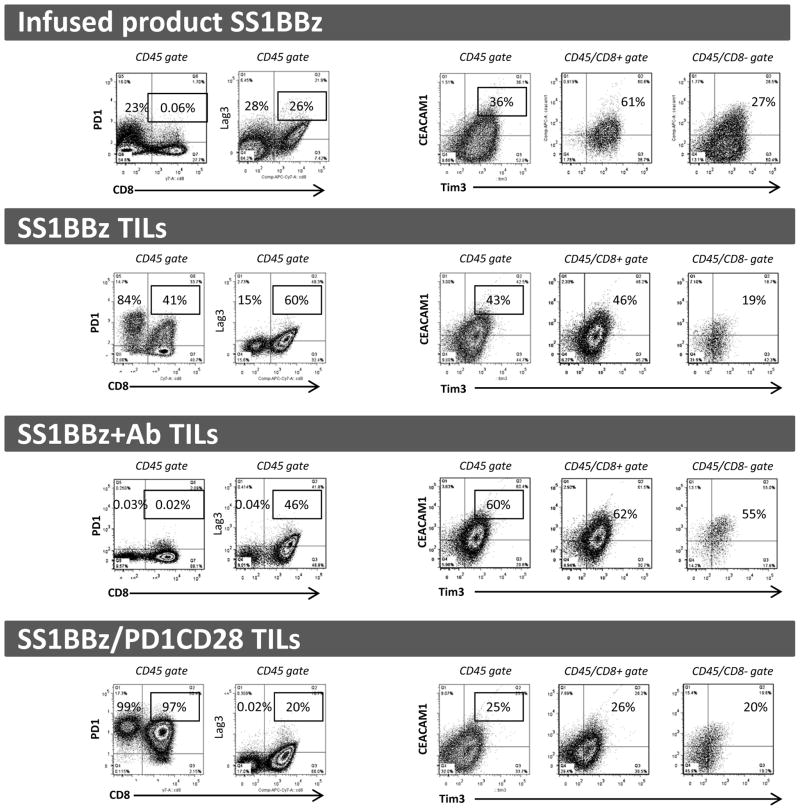
Figure 5. PD1CD28 leads to reduced upregulation of IRs on SS1BBz TILS.
Single cell suspension from digested tumors were subjected to FACS analysis to measure expression of PD1, Lag3, Tim3, and CEACAM1. The first three dot plots of each row represent analyses of cells in the CD45+ gate. The fourth and fifth dot plot of each row represents analyses of cells in the CD45+/CD8+ and CD45+/CD8− gates respectively. The highlighted percentages represent frequency of PD1+ events among CD8+ events (the first two dot plots) and the frequency of Tim3/CEACAM1 double-positive events (the last three dot plots.) Each row demonstrates representative analysis of TILs from three independent animal experiments. Infused product SS1BBz T-cells were used as control comparisons for baseline levels of IRs prior to adoptive transfer into mice.

