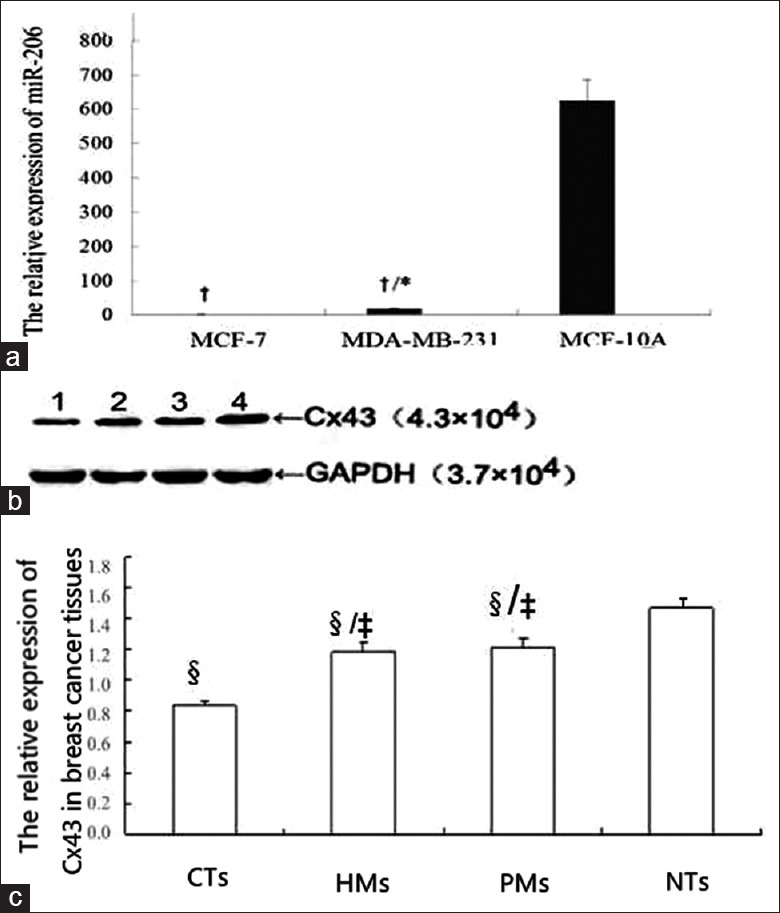
Figure 1.

The expression of MiR-206 and connexin 43 in breast tissues and cells. (a): *P < 0.05, compared with MCF-7; †P < 0.05, compared with MCF-10A. When miR-206 expression in MCF-7 cells was set at 1, miR-206 expression in normal breast cell line MCF-10A was 639.13±13.04, significantly higher than that in MCF-7 and MDA-MB-231 (15.54±0.84), while miR-206 expression in MDA-MB-231 was higher than that in MCF-7. (b): Western blotting image; (c): Statistic graph of graph b. Lane 1: breast cancer tissues; lane 2: hepatic metastasis; lane 3: pulmonary metastasis; lane 4: normal breast tissues; NTs: normal breast tissues; CTs: breast cancer tissues; HMs: hepatic metastasis; PMs: Pulmonary metastasis; ‡P < 0. 05, compared with CTs group; §P < 0. 05, compared with NTs group; Cx43 protein expression in CTs, HMs and PMs was significantly lower than that in NTs (P < 0. 05). Cx43 protein expression in HMs and PMs was significantly higher than that in CTs (P < 0. 05).
