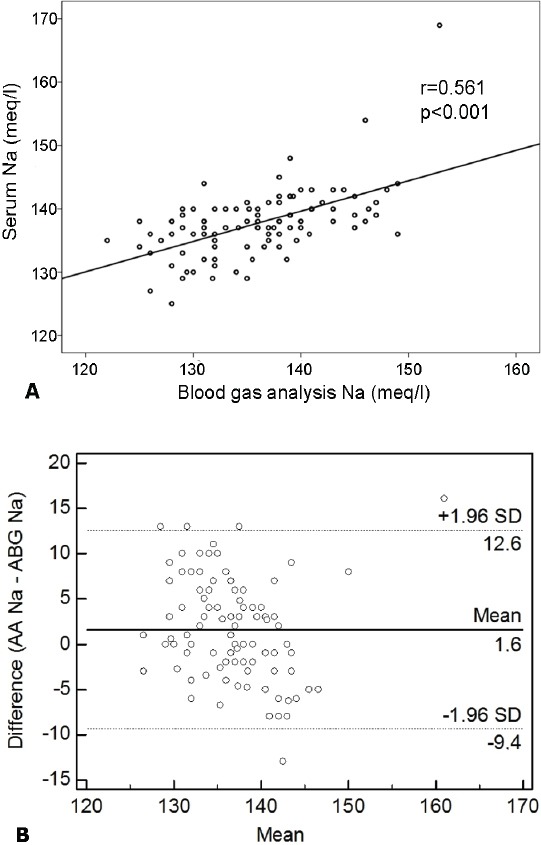
Figure 1.

The correlation of sodium levels. A) A Bland-Altman comparison of AA and ABG for the Na measurement revealed that the limits of agreement were -9.4 to 12.6 mmol/L. Relationship between Na levels measured by 2 analyzing methods. Pearson’s correlation coefficient (r): (r: 0.561, p<0.001). B) Bland-Altman comparison of AA and ABG for Na showing the 95% limits of agreement. Plot of the difference of 2 methods against the mean of 2 methods for Na measurement. Solid line - mean difference, dashed lines - mean difference plus or minus 2 standard deviations, Na - Sodium, AA - auto-analyzer, ABG - arterial blood gas analyzer.
