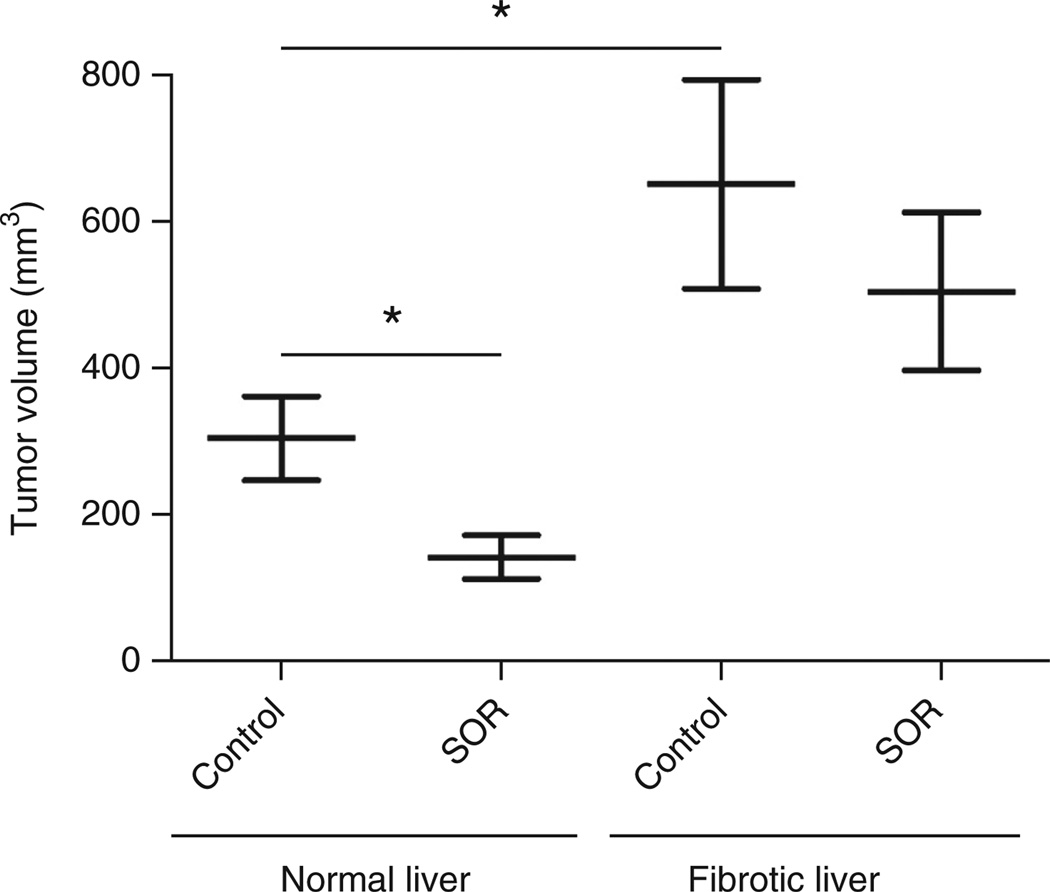
Figure 5.
Differential tumor growth rates and treatment response in orthotopic HCC growing in normal livers versus fibrotic livers. Treatment was given when HCCs were established (7–10 d after intrahepatic HCA-1 cell inoculation). Mice were treated daily by gavage with sorafenib (40 mg/kg) or control vehicle (PBS) alone for 2 weeks. n = 5–13, *P < 0.05. Comparisons between treatment groups were performed using the Mann-Whitney U-test. Adapted with permission from ref. 7.

