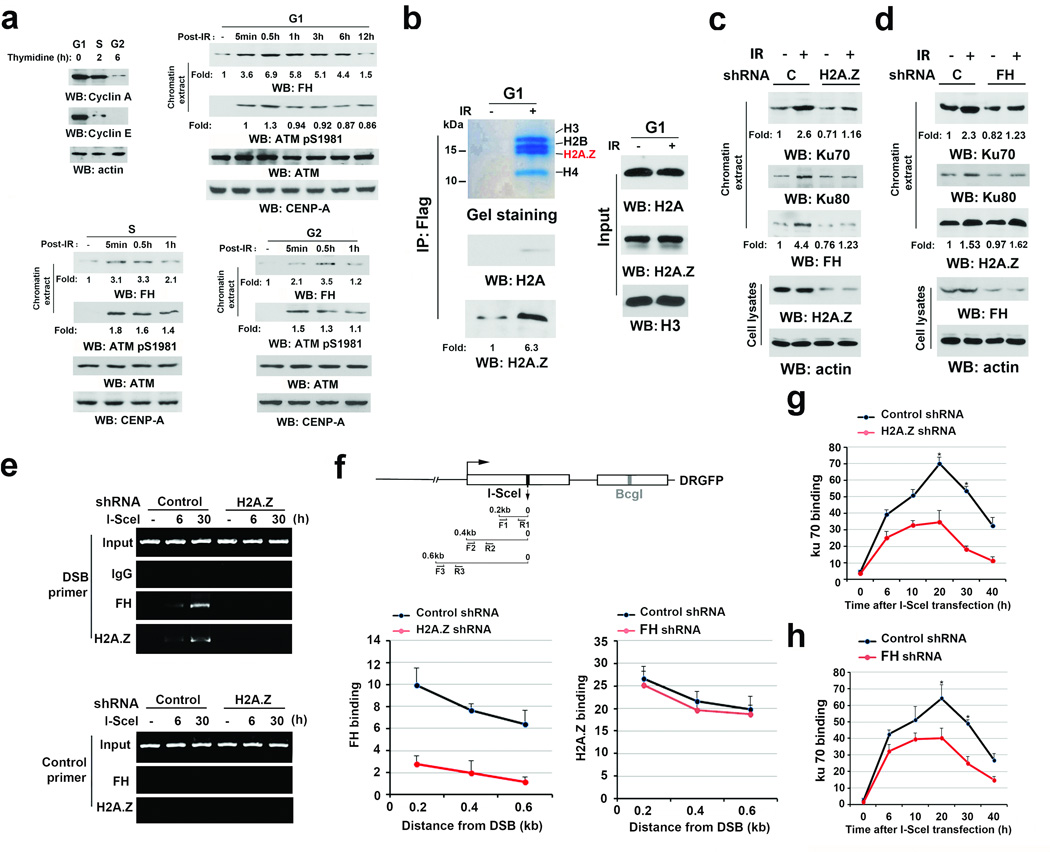
Figure 1. H2A.Z-regulated recruitment of FH to DSB regions promotes the accumulation of Ku70 at DSB regions.
a–d, Immunoblotting and e–h, ChIP analyses were performed using the indicated antibodies. a–e, Data represent one out of 3 experiments.
a, U2OS cells synchronized by thymidine double block (2 mM) underwent no release (upper right panel, G1 phase) or release for 2 h (bottom left panel, S phase) or 6 h (bottom right panel, G2 phase). These cells were then exposed to IR (10 Gy) and harvested at the indicated time after IR. Chromatin extracts were prepared. CENP-A was used as a control for chromatin-associated proteins.
b, Thymidine double block-synchronized U2OS cells expressing Flag-FH were exposed to IR (10 Gy) and harvested 1 h after IR. Chromatin extracts subjected to immunoprecipitation with an anti-FH antibody were analyzed by Coomassie brilliant blue staining and immunoblotting analyses.
c, d, Thymidine double block-synchronized U2OS cells, with or without H2A.Z shRNA (c) or FH shRNA (d) expression, were exposed to IR (10 Gy) and harvested 1 h after IR. Chromatin extracts and total cell lysates were prepared.
e, f, g, h, U2OS cells expressing the DR-GFP reporter, with or without H2A.Z shRNA, were transfected with a vector expressing I-SceI. ChIP analyses with the indicated antibodies were performed at the indicated time points (e, g, h) or 30 h (f) after I-SceI transfection. The indicated primers covering a range of distances from the cutting open site (f) or F1/R1 (e, g, h) primers were used for the PCR. Control primers were selected against a specific region of chromosome 12. The y-axis stands for the value of the I-SceI-induced fold increase of specific protein binding (the IP value was normalized to the input). The data represent the mean ± SD (n=3 independent experiments). * stands for P < 0.01 between the cells expressing control shRNA and the cells expressing the indicated shRNA.

