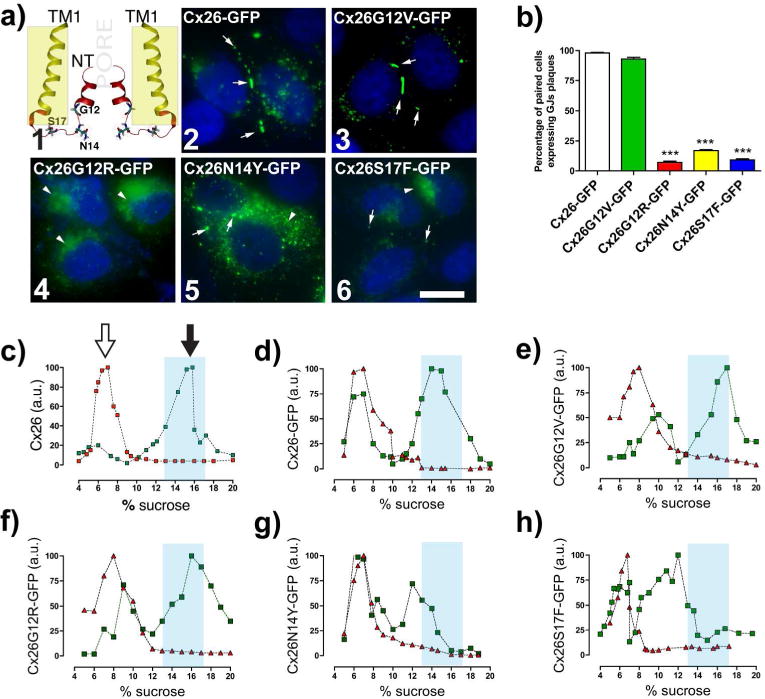
Figure 1. Syndromic mutations reduce or eliminate GJC formation.

(a1) TM1 and NT of two Cx26 subunits with highlighted residues at the NT that are linked to deafness mutations. Yellowish rectangle indicates plasma membrane region. (a2–6) Confocal images show the respective subcellular localization of cells expressing Cx26 wild type or mutants. White arrows indicate GJ plaques. (a2 and 6) Arrowheads indicate perinuclear labeling. Bar=15 μm. (b) Percentage of paired cells expressing GJ plaques per condition. (***p<0.001; n=5, 250 paired cells for condition). (c–h) Syndromic mutations, N14Y and S17F, affect oligomerization. Graphs represent the sedimentation profile of monomer and oligomers (in arbitrary units of Cx amount, a.u.) of WT or mutants Cx26. SDS treated fractions (red triangles). Black-filled arrows in (c) show the hexameric peak, and the unfilled arrows show monomeric peaks. Light blue columns indicate where WT Cx26 hexamers sedimented (n=4).
