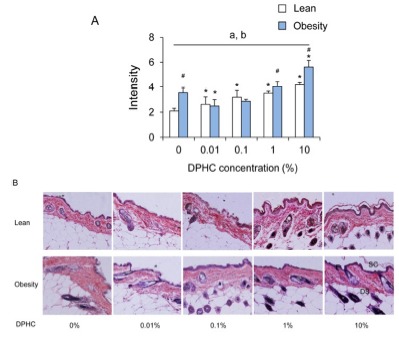
Fig. 3. Changes in intensity of elastin fibers of dorsal back integument in a given area of lean and obesity mice.

(A) Intensity of elastin fibers was analyzed using ImageJ v1.33 and the Color Histogram plug-in. (B) Micrograph of the skin section stained with Verhoff-Van Gieson staining (×100, (insertion, ×400)). Elastic fiber stained blueblack to black. Collagen stained red. Nuclei stained blue to black. Abbreviation: SC, stratum corneau; E, viable epidermis; DS, dermis and subcutis.
