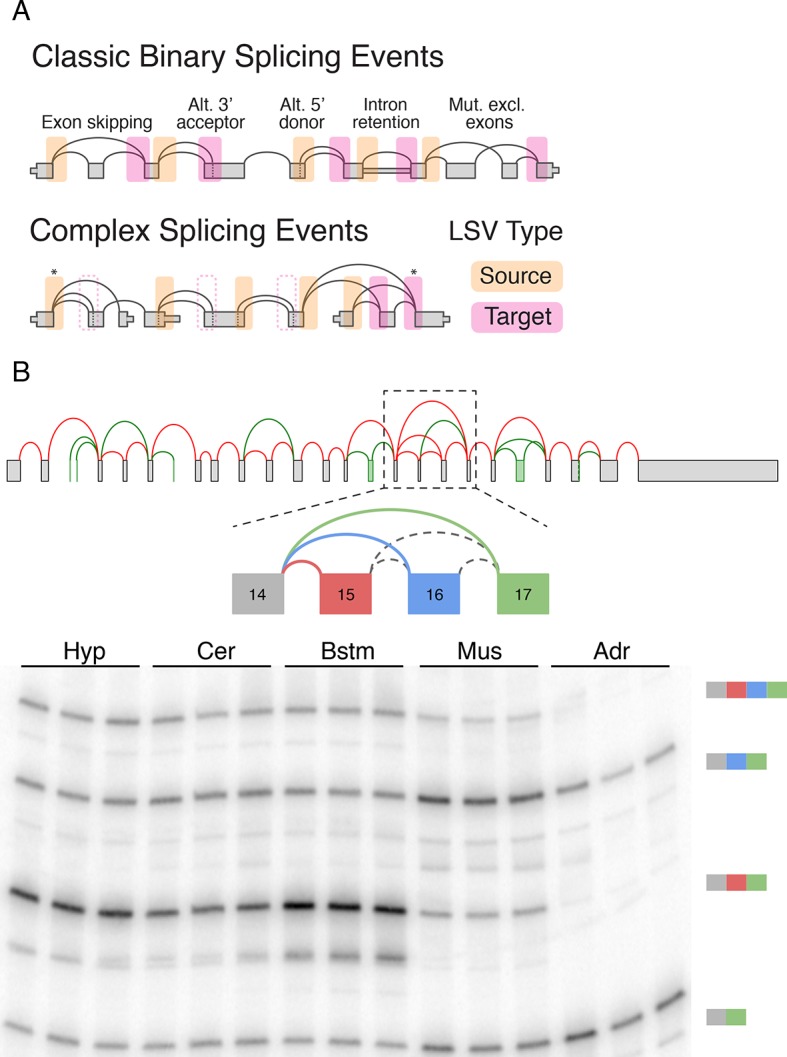
Figure 1. LSV formulation and prevalence.

(A) LSVs can be represented as splice graph splits from a single source exon (yellow) or into a single target exon (pink). LSV formulation captures previously defined, 'classical', binary alternative splicing cases (top) as well as other variations (bottom). An asterisk denotes complex variations involving more than two alternative junctions; dash line denotes redundant LSVs that are a subset of other LSVs (see Materials and methods). (B) Example of a complex LSV in the Camk2g gene. The gene’s splice graph (top) includes known splice junctions from annotated transcripts (red) and novel junctions (green) detected from RNA-Seq data. The splice graph includes a complex LSV involving exons 14–17 (middle). RT-PCR validation of the LSV in brainstem, cerebellum, hypothalamus, muscle, and adrenal is shown at the bottom. Several isoforms are preferentially included in brain and muscle.
