Figure 6. Identification of a novel, brain-specific, PTC-introducing, developmentally-regulated exon in Ptbp1.
(A) Top: Splice graph representation of a complex target LSV containing a previously unannotated, PTC-introducing exon in Ptbp1 (exon 14, green). Stop signs indicate multiple conserved premature termination codons. Bottom: UCSC Genome Browser tracks of RNA-seq reads from adrenal (red) and cerebellum (blue), and conserved Rbfox binding sites ([U]GCAUG) found within the bounds of this LSV. (B) Top panel: RT-PCR validation of RNA from replicate cerebellar and adrenal tissues with isoforms illustrated on the left. Asterisk denotes a background band that migrates non-specifically. Bottom panel: E[Ψ] violin plots of MAJIQ quantification for the colored junctions in (A). Matching isoforms are indicated on the left. (C) Top: RNA-seq reads from mouse cortices (Yan et al., 2015). Developmental time points indicated on the right with exons colored as in (A). Bottom: Ψ violin plots for the PTC-introducing exon 14 across brain development. (D) Top panel: Top regulatory motifs predicted by AVISPA to influence the neuronal-specific splicing of exon 14. Stacked bars represent the normalized feature effect (NFE) for each motif. Colors indicate the contribution of the corresponding motif in the region indicated in the inset. (E) MAJIQ Ψ quantification of the LSV shown in (A), using RNA-seq from one month old wild type whole brain (left) and nestin-specific Rbfox1 KO littermates (right).

Figure 6—figure supplement 1. Novel exon and PTCs in Ptbp1 are conserved, independent from known PTC event, and regulated by Rbfox1 and 2.

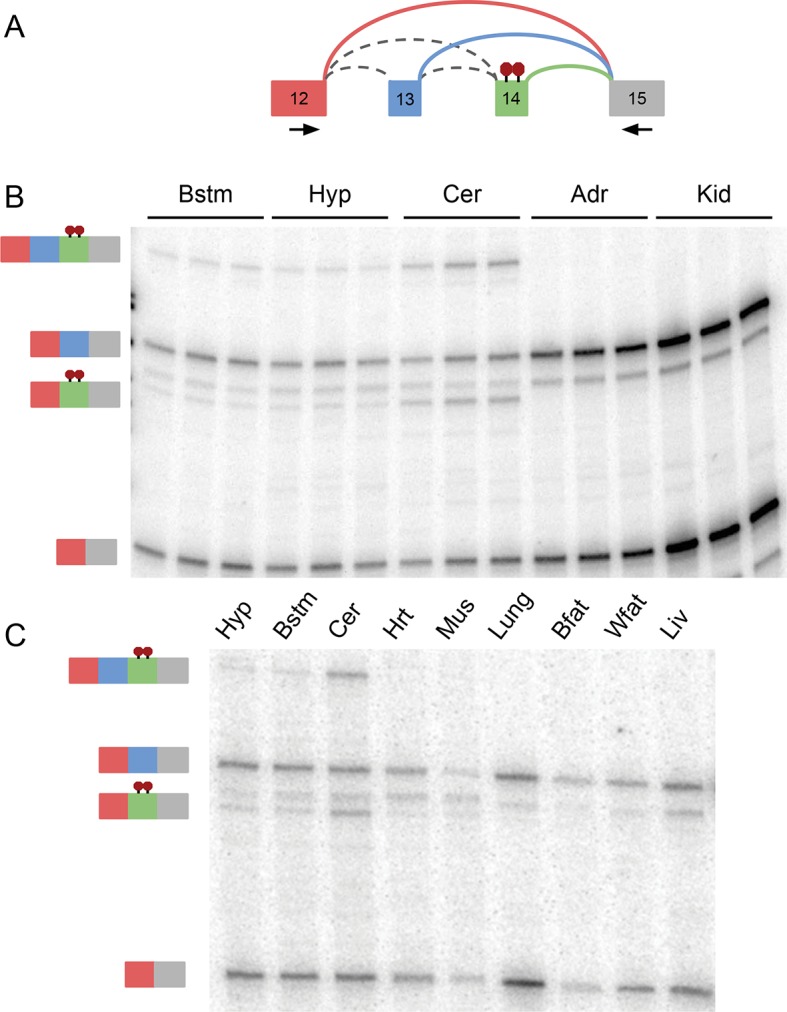
Figure 6—figure supplement 2. RT-PCR validation of complex Ptbp1 LSV across 11 mouse tissues. .