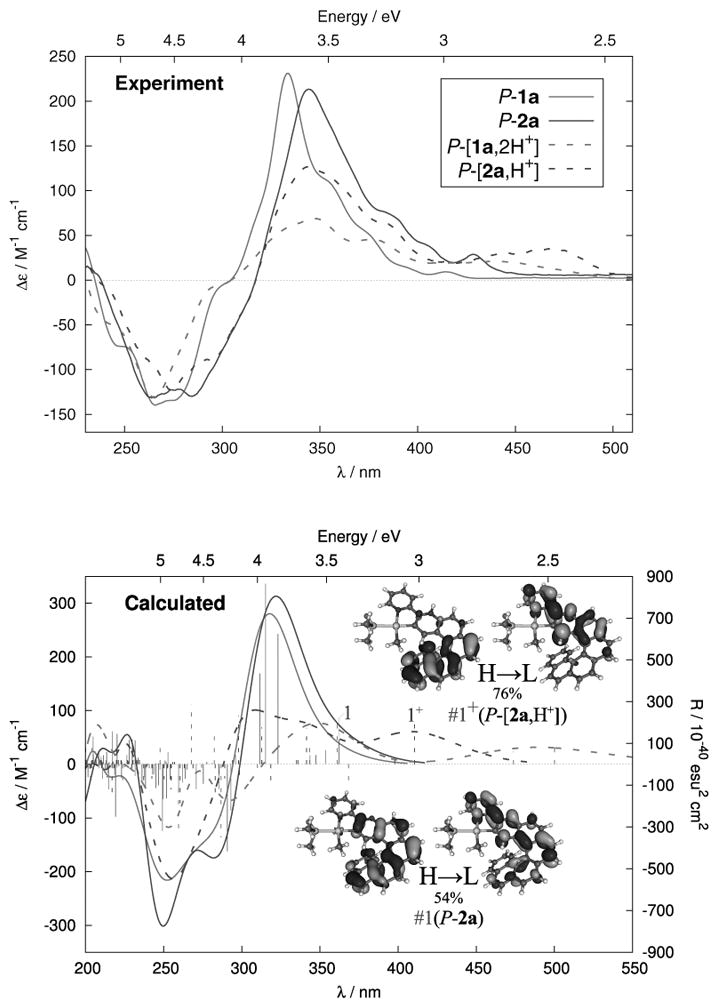
Figure 1.

Measured (up, CH2Cl2, ~10−5 M) and calculated (bottom) BHLYP CD spectra of proligand P-1a (plain grey), P-[1a,2H+][2BF4−] (dotted grey), and of complexes P-2a (plain black) P-[2a,H+][BF4−] (dotted black). Frontier MOs (0.03 au) of P-2a and P-[2a,H+]. For assignments of the spectra see the SI.
