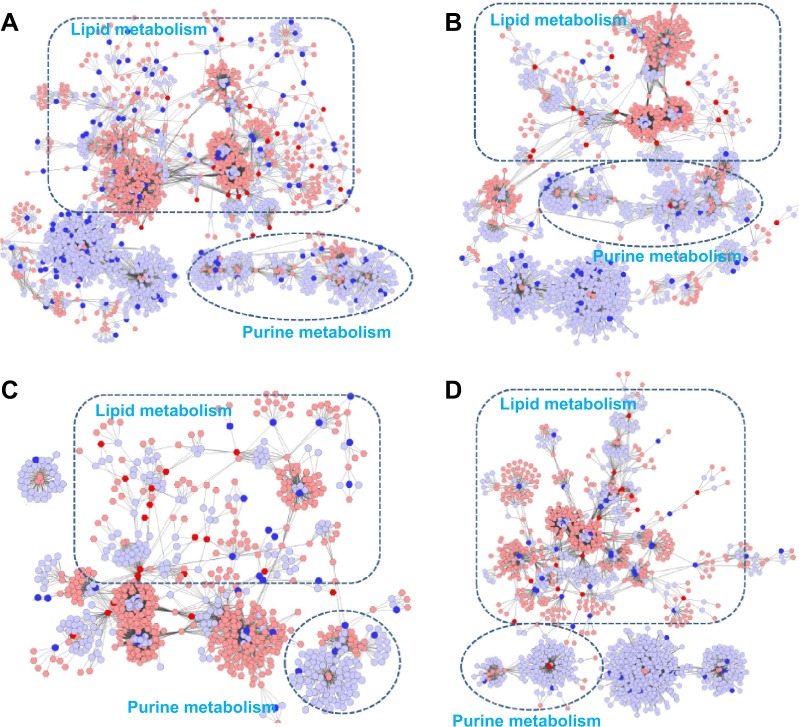
Figure 4.
Correlation networks of the metabolites, genes, and proteins regulated in lung tissues of COPD rats and BJF-treated rats.
Notes: The compound reaction network with compounds (the pink and red hexagons) and metabolic enzymes (the gray and blue rounds) as nodes and reactions as edges, was constructed using Metscape. Inputted compounds are shown in red, inputted genes and proteins are shown in blue. Existing compounds that populate the Metscape system were shown in pink. Existing genes and proteins were shown in gray. (A) Representative metabolites–gene network of COPD model group. (B) Representative metabolite–gene network of the BJF-treated group. (C) Representative metabolites–protein network of the COPD model group. (D) Representative metabolite–protein network of the BJF-treated group.
Abbreviation: BJF, Bufei Jianpi formula.

