
Figure 2.
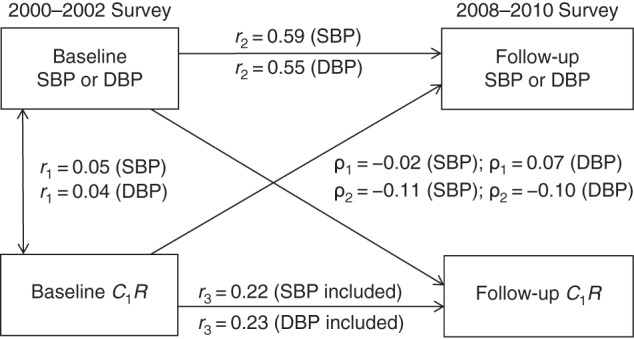
Cross-lagged path analysis models for the association of systolic blood pressure (SBP) and diastolic blood pressure (DBP) with large-artery elasticity (C1R) in the total sample (n = 381), Bogalusa Heart Study, 2000–2010. Results were adjusted for race/ethnicity, age, sex, body mass index, heart rate, smoking, diabetes, and duration of follow-up. ρ1, cross-lagged path coefficient from baseline C1R to follow-up blood pressure (BP); ρ2, cross-lagged path coefficient from baseline BP to follow-up C1R. r1 represents synchronous correlations; r2 and r3 represent tracking correlations. Variance of follow-up BP explained: R2 = 0.36 (SBP) and R2 = 0.31 (DBP); variance of follow-up C1R explained: R2 = 0.16 (SBP included) and R2 = 0.12 (DBP included). For r2 and r3 being different from 0 for SBP and DBP, P < 0.01; for difference in SBP between ρ1 and ρ2, P = 0.214; and for difference in DBP between ρ1 and ρ2, P = 0.019.