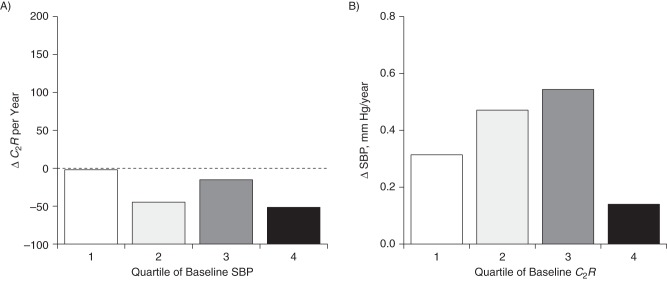
Figure 6.
Yearly rates of change (Δ) in small-artery elasticity (C2R) (A) and systolic blood pressure (SBP) (B) according to quartiles of their baseline values in the total sample (n = 381), Bogalusa Heart Study, 2000–2010. Results were adjusted for race/ethnicity, sex, age, body mass index, heart rate, smoking, and diabetes. P-trend = 0.875 for ΔC2R; P-trend = 0.331 for ΔSBP.

