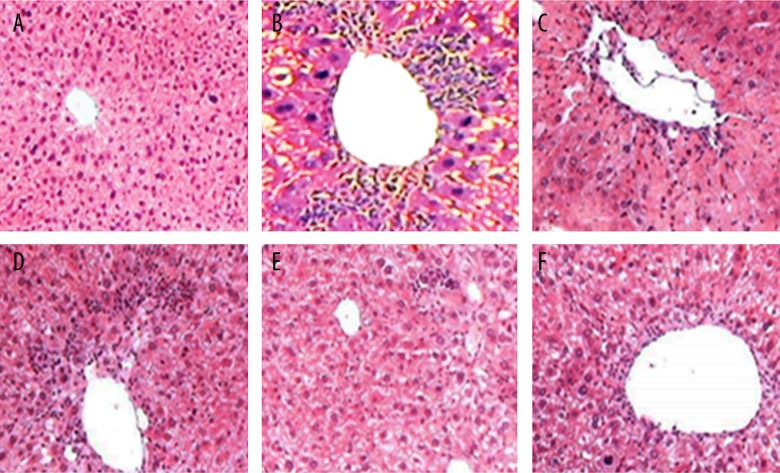
Figure 1.
Representative images of histological examination results of mice liver tissues stained with hematoxylin and eosin (×250) (A the control Group; B the CCl4-model group; C the low GSP dose group; D the DDB group; E the moderate GSP dose group; F the high GSP dose group). Note: CCl4 – carbon tetrachloride; GSP – grape seed proanthocyanidins; DDB – bifendate.

