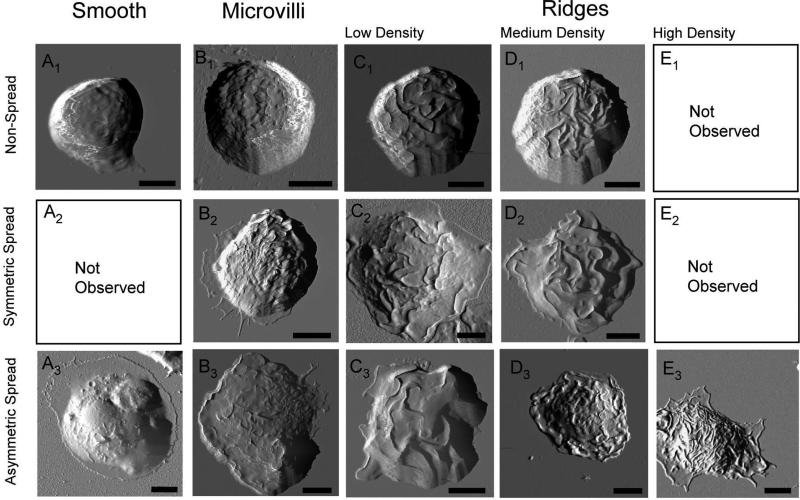
Figure 1.
AFM deflection images represents the 12 characteristic morphologies associated with cell spreading behavior. Escalating membrane texture (from left to right) can be observed in both symmetric (top rows, ratio less than 1.2) and asymmetric bone marrow-derived mast cell morphology (bottom rows, ratio larger than 1.2). The corresponding quantification of cell spreading associated with these cells is provided in Table I. Whole cell images of the fixed specimens were conducted in contact mode with CSC38 cantilevers (k = 0.03 N/m, MikroMasch lever B). Scale bars are equal to 5 μm.

