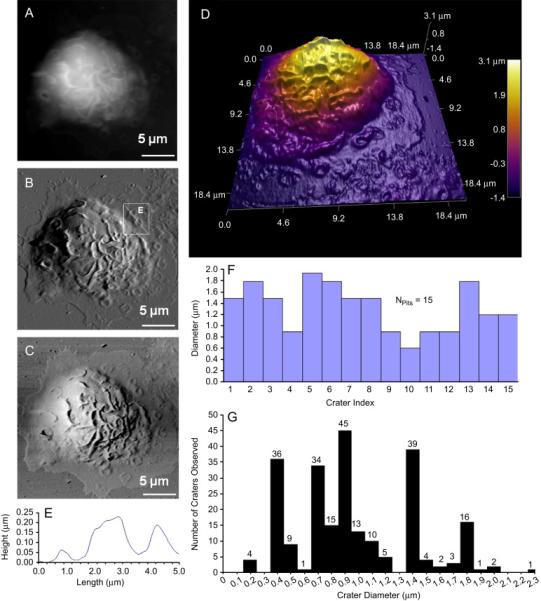
Figure 5.

Craters are observed at membrane surface of BMMCs absorbed onto poly-L-lysine. [A], [B] and [C] represent the height, deflection, and lateral images of the chosen BMMC, respectively. A three dimensional rendering of the AFM topograph is provided in [D]. The width and depth of craters can be measured from cursor profiles as illustrated in [E] and summarized in [F]. Out of 37 cells presenting with 240 craters, the histogram display the frequency of crater diameters in graph [G]. AFM images of the fixed cell was conducted in contact mode with CSC38 cantilevers (k = 0.03 N/m, MikroMasch lever B).
