Figure 2.

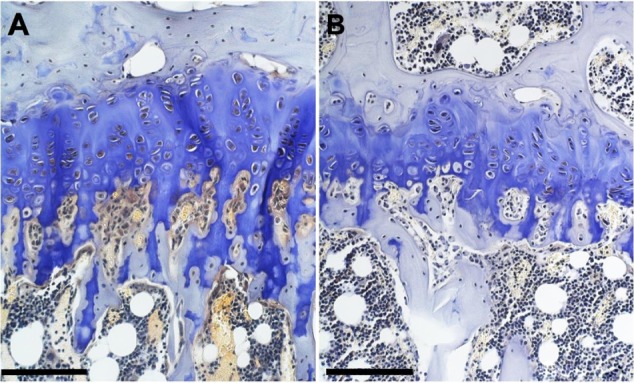
Micrographs of the proximal tibial growth plate of (A) control and (B) genistein-fed ob/ob mice.
Notes: Scale bar is 100 μm. Toluidine blue and aqueous fast green stains were used, 40× magnification.

Micrographs of the proximal tibial growth plate of (A) control and (B) genistein-fed ob/ob mice.
Notes: Scale bar is 100 μm. Toluidine blue and aqueous fast green stains were used, 40× magnification.