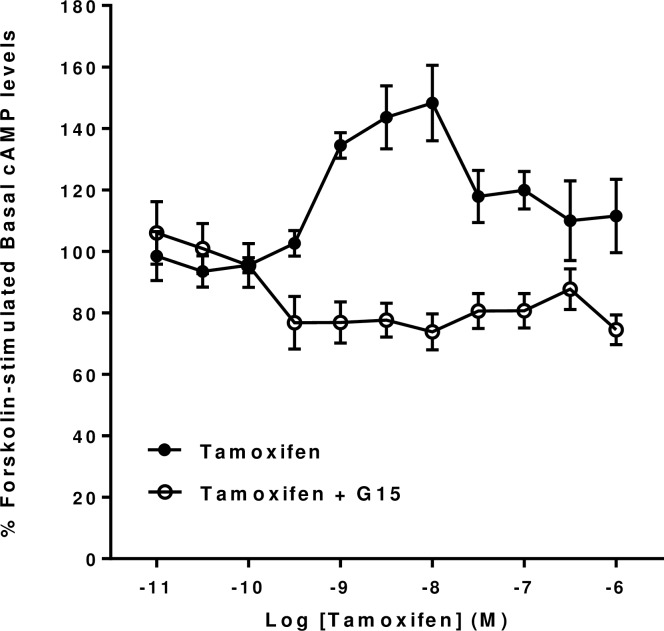
Fig 6. Effect of the GPER antagonist G15 on Tamoxifen forskolin-stimulated cAMP levels in mHippoE-18 cells.
mHippoE-18 cells were pre-incubated with 100 μM IBMX and 1 μM of G15 for 20 min, followed by incubation with varying concentrations of Tamoxifen, 1 μM antagonist, 10 μM forskolin and 100 μM IBMX for a further 20 min. The basal value in the absence of agonist and antagonist is shown as 100%. The Tamoxifen-only response in the absence of antagonist is shown for comparison. Values are significantly different from basal as follows: Tamoxifen see Fig 2; Tamoxifen + G15, 0.3 nM and above (except for 300 nM), p <0.05. Data are expressed as the mean ± SEM. n ≥ 3.

