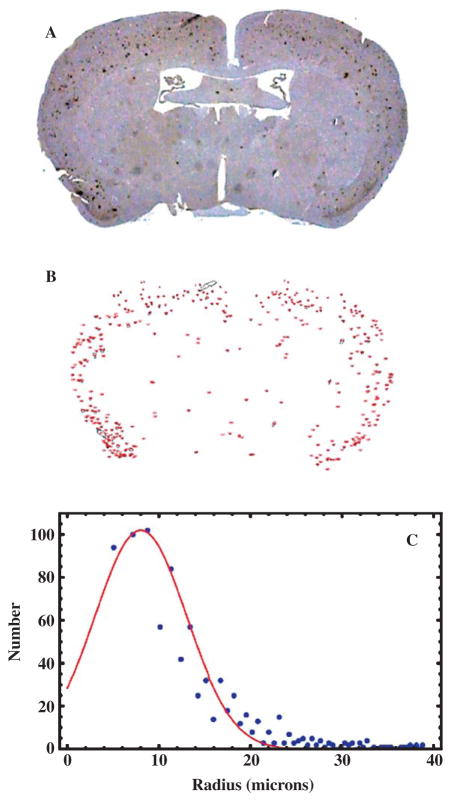
Fig. 2.
Histological plaque distribution in the AβPP/PS1 mouse brain. A) Optical microscopy of a 7 μm thick coronal section of a transgenic mouse brain stained, via immunohistochemistry, for human Aβ, which revealed the plaques as brown spots. B) A binary image, thresholded using ImageJ, showing the segmentation of the image in (A) into recognized plaques whose areas were subsequently measured. This particular slice contained a total of 198 plaques. C) Distribution of plaque sizes (radii) in the AβPP/PS1 mouse brain. The measured radii are shown as blue circles, while the red curve is a fitted Gaussian with a mean of 8.0 μm and a width of 3.5 μm. A Poisson fit gave essentially the same results as the Gaussian fit.

