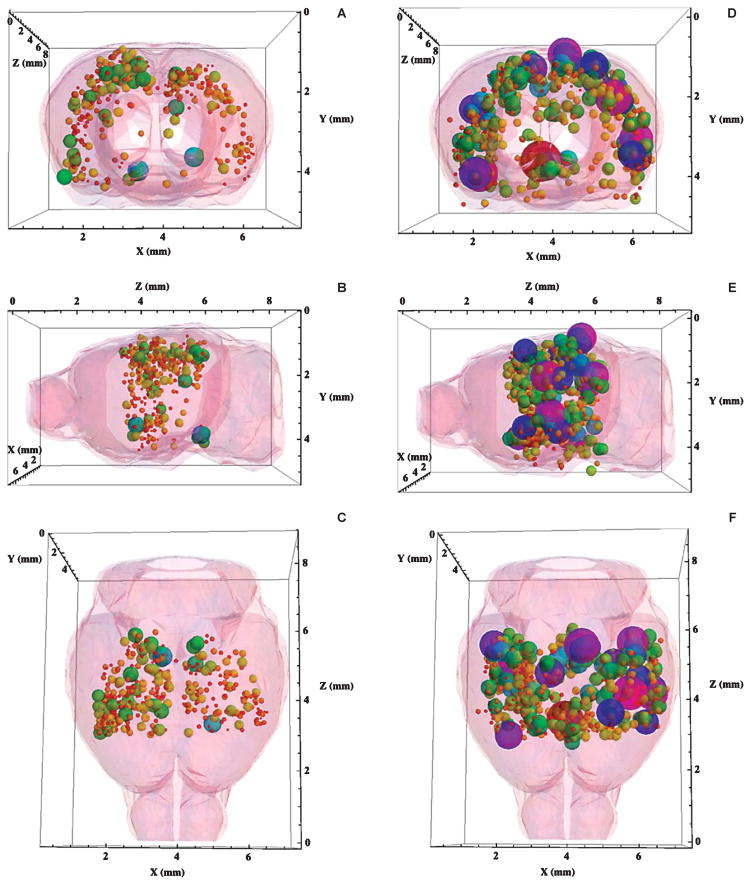
Fig. 4.
A–C) Three-dimensional displays of the complete plaque distribution in the brain of an AβPP/PS1 mouse untreated with SPIONs. The 3D plaque distribution data were embedded within a Mathematica-rendered surface plot of the mouse brain generated from coordinates obtained from the Allen Institute for Brain Science. The size and color of each sphere was proportional to the Z-score of the plaque located at that set of (x, y, z) coordinates measured from the MR images (given in Fig. 3A) showing that plaques (n = 355) were detected without the aid of a contrast agent (Z = 4.6 ± 0.6). Red corresponded to Z = 2.5, while purple coded Z = 20. The diameter of each sphere gave its Z-score in these coordinates. A) A coronal view of the brain from the front. Note the predominance of lesions in the cortex from this viewpoint. B) A sagittal view of the brain from the left side, the front was to the left. C) A transverse view of the brain from the top, the front was at the bottom. D–F) Three-dimensional displays of the complete plaque distribution in the brain of an AβPP/PS1 mouse treated with anti-human AβPP-conjugated SPIONs. Size and color correlate as in A, B, and C. SPION treatment demonstrated a marked increase in both the number (n = 668) and the Z-score (8.0 ± 0.1) of the detected lesions. D) A coronal view of the brain from the front. E) A sagittal view of the brain from the left side, the front was to the left. F) A transverse view of the brain from the top, the front was at the bottom.

