
Fig. 5.
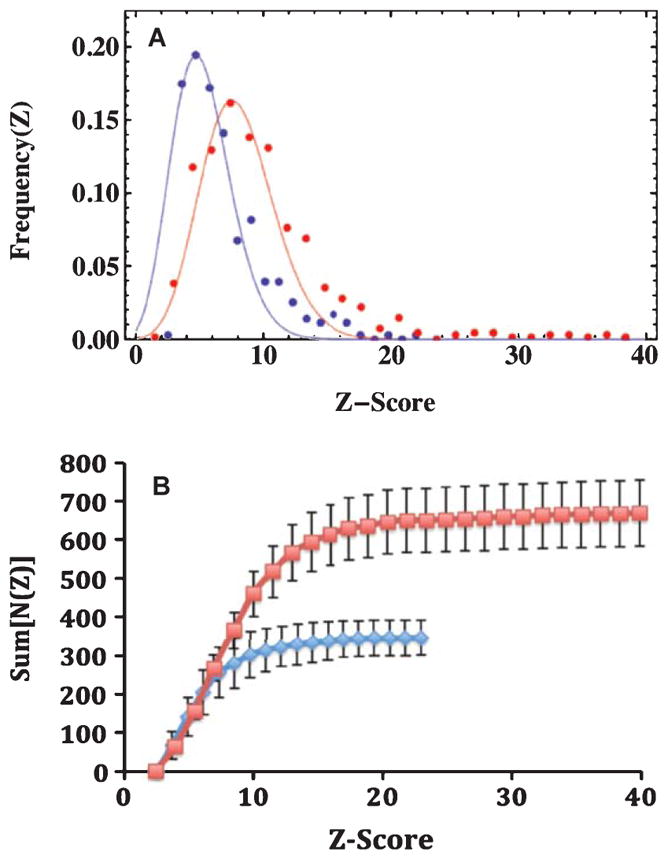
The distribution of Z-scores from the MRI data among brains from the AβPP/PS1 mice imaged for this study. A) Poisson fits to the normalized differential frequency distributions of Z-scores for MRI detected plaques in the brains of AβPP/PS1 mice comparing SPION treatment with controls. The Blue points and curve were data from control mice, with a mean of 5.1 (n = 355 plaques), while the Red points and curve were from mice treated with anti-AβPP SPIONs, with a mean of 8.3 (n = 668 plaques). Note how the presence of SPI-ONs in the brain markedly increased the conspicuity (Z-score) of the plaques. The normalized Z-score data were well fit by Poisson distributions, whose means were the only free parameters of the fits. Once the means were specified, the amplitudes and widths were fixed. The probability that the means of the two distributions were the same was p < 0.0001 as reported by Student’s t-test with unequal variances. B) The integral distributions of the MRI-determined plaque data. The colors indicate the treatment received: Blue diamonds were for control AβPP/PS1 mice, while the Red squares denote the data from AβPP/PS1 mice injected with anti-human AβPP conjugated SPI-ONs. The errors shown are the standard deviations (n = 4). The brains from the SPION injected mice displayed twice as many lesions (668) as the control mice (347) with a marked increase in the maximum Z-score from 23 to 40.