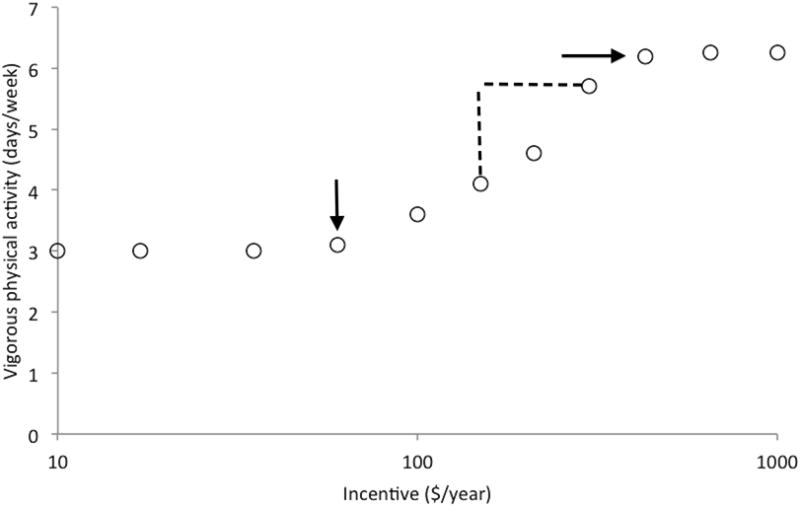
Figure 2.

Demand curves capture key aspects of individual behavioral responses to incentives. Key points captured in individual demand curves are: pre-existing levels of physical activity, the amount of monetary incentive required to initiate an increase in activity (breakpoint, vertical arrow), change in behavior given incremental change in incentive level (elasticity, dashed line vertical length divided by horizontal length), steady-state maximum activity that an individual is capable of or willing to perform at the highest levels of incentive deemed feasible by the program (intensity, horizontal arrow).
