Figure 4.


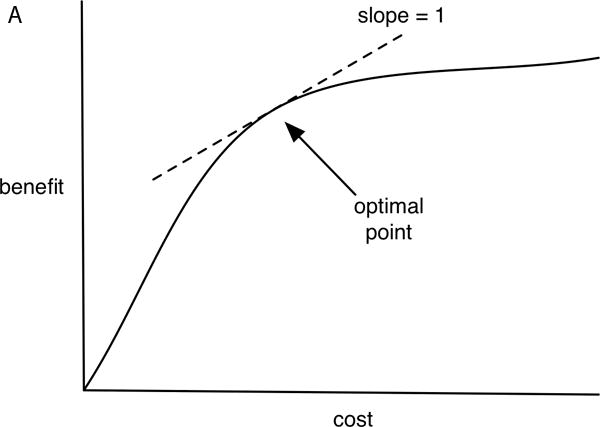
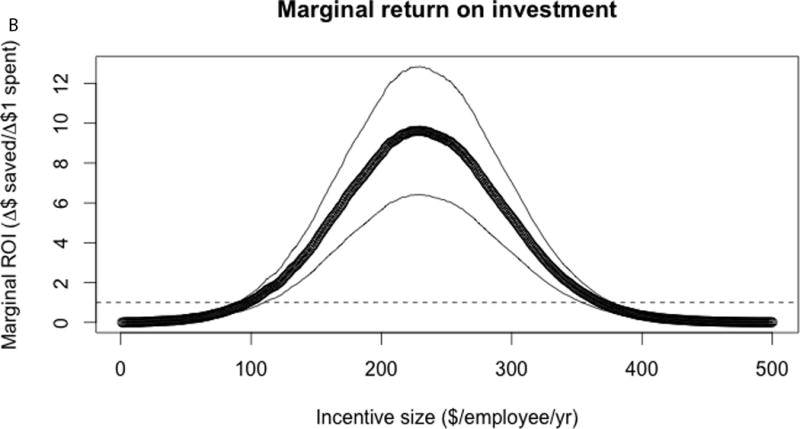
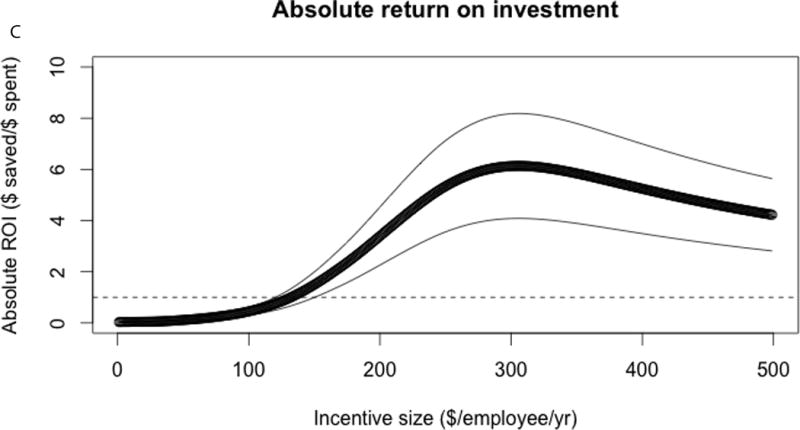
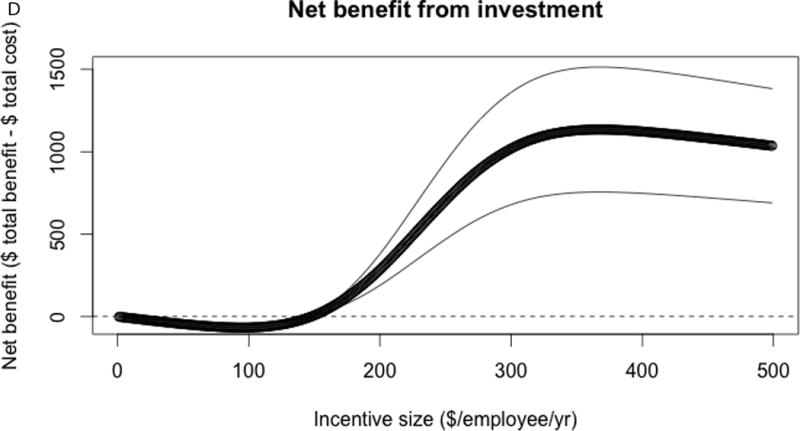
Optimization of the model. The optimization process attempts to find (A) the point where marginal return on investment (the slope of the cost v. benefit curve) equals 1, which is the point where net benefits (total dollars of cost averted minus total dollars spent) is maximized. (B) Marginal return on investment (dollars of costs averted for each additional $1 spent) increases then decreases with greater incentive size, ultimately falling below $1 of savings for each $1 spent on incentives. Here we use physical activity program data from a national sample of cash-benefit physical activity programs as inputs to the model (11). The mean result from 10,000 repeated replications of the model is illustrated as a thick black line, with 95% confidence intervals as thin gray lines. For reference, we also show the (C) absolute return on investment (total dollars of costs averted divided by total dollars spent), and (D) net benefit (total dollars of costs averted minus total dollars spent) per employee. Total benefits and total costs are plotted in Appendix Figure 2.
