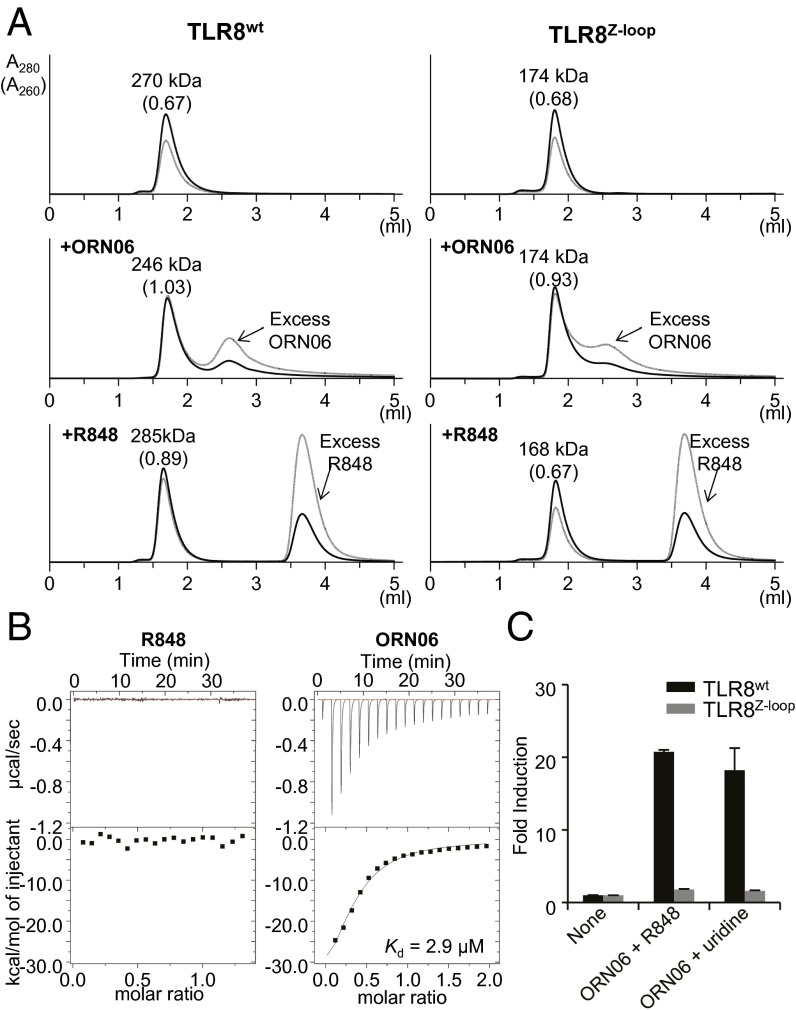
Fig. 2.
Oligomerization state and ligand binding of TLR8Z-loop. (A) Gel filtration chromatography of TLR8wt and TLR8Z-loop. TLR8wt (Left, Top), TLR8wt/ORN06 (Left, Middle), TLR8wt/R848 (Left, Bottom), TLR8Z-loop (Right, Top), TLR8Z-loop/ORN06 (Right, Middle), and TLR8Z-loop/R848 (Right, Bottom) were analyzed by Superdex 200 gel filtration chromatography. The black and gray lines show absorbance at 280 nm (A280) and 260 nm (A260), respectively. Molecular weights estimated from elution volume are shown above the peak. The ratios of A260 to A280 are given in parentheses. (B) ITC analysis of TLR8Z-loop titrated with R848 (Left) and ORN06 (Right). (C) NF-κB activation by TLR8WT and TLR8Z-loop. The response to agonistic ligand under synergistic conditions was assessed using NF-κB–dependent luciferase assay. To induce synergy, cells were treated for 6 h by indicated TLR8 ligands. Data represent the mean fold induction of NF-κB activity, calculated as the RLU of stimulated cells divided by the RLU of nonstimulated cells. Data from three independent experiments are shown.

