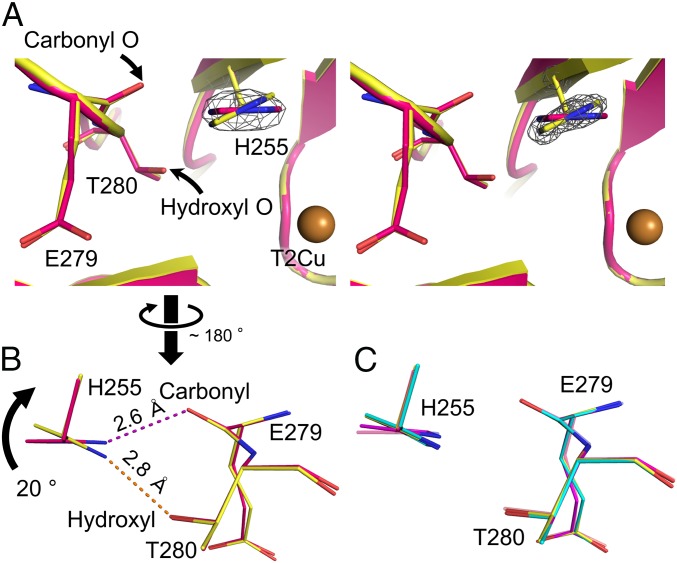
Fig. 2.
Conformational change of His255 (molecule A). (A) The sigma-A–weighted 2Fo–Fc maps (3.0 σ, gray) around His255 in the SFX RS structure (Left) and the SRX RS structure (Right). (B) Switching of H-bond partners. The SFX RS and SRX RS structures are shown in pink and yellow, respectively. Dashed lines represent H-bonds. (C) Comparison of the His255 conformation. The SRX RS, SFX NC, and SRX NC structures are shown in yellow, magenta, and cyan, respectively. The SFX RS structure is shown in light pink.

