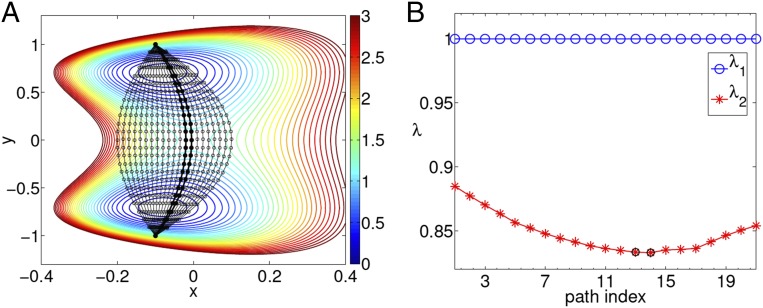
Fig. 1.
In A, we provide the 2D De Leon–Berne potential (48) with several candidate path CVs imposed on it. Black circles denote the corresponding landmarks (49). See Supporting Information for further details of path CVs. In B, the corresponding eigenvalues and (i.e., excluding the stationary eigenvalue ) are shown for each of these paths. As per the spectral gap given here by , we identify two possible good paths marked with black circles in B and correspondingly with thicker black lines in A. Energy is in absolute units and .

