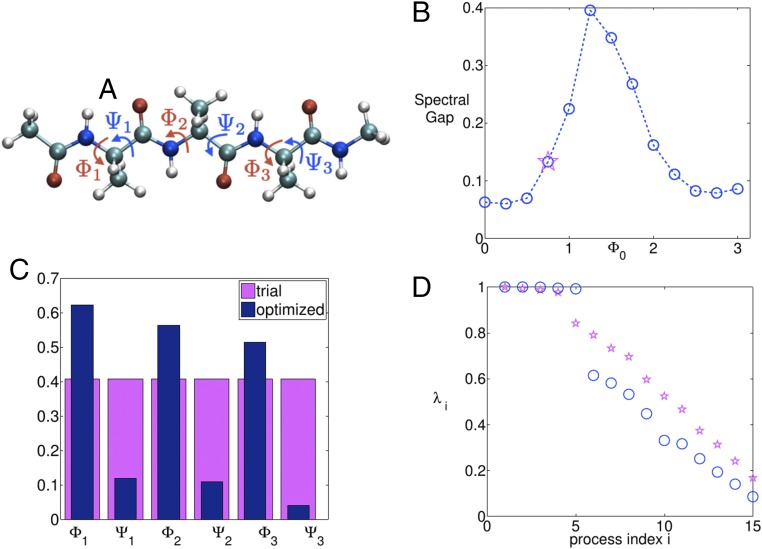
Fig. 2.
(A) The five-residue peptide studied in this work. The six dihedral angles are marked. (B) The output of the simulated annealing algorithm run separately for different values (blue circles). The starting value with the trial choice of CV is marked with a magenta-colored star. (C) The trial (magenta) and optimized (blue) mixing coefficients for the six dihedrals. (D) The spectrum of eigenvalues for dynamics projected on the trial (magenta) and optimized (blue) CVs. A distinct improvement can be seen in the spectral gap. Process index i refers to the ith index in the transition matrix.

