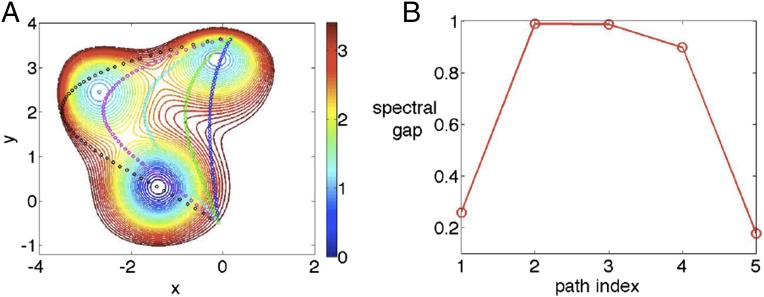
Fig. S1.
(A) Three-state potential with five trial path CVs imposed on it, and (B) corresponding spectral gaps. Energies are in absolute units and simulation temperature was . In both figures, paths are to be counted in the same order, and the second and third paths counting from the left have the maximal spectral gaps. These can be seen to be roughly the minimum energy pathways.

