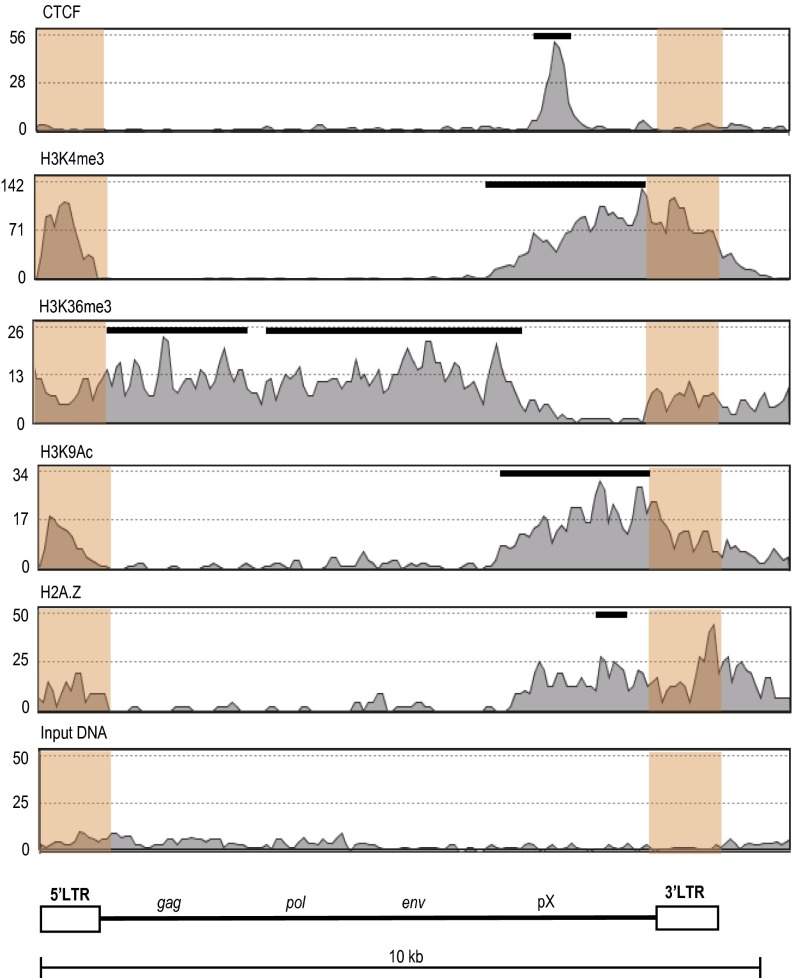
Fig. 3.
Epigenetic landscape of HTLV-1 provirus analyzed by ChIP-seq. Enrichment of CTCF, H3K4me3, H3K36me3, H3K9Ac, and H2A.Z in ED cells is shown. These data are aggregated from two biological replicate experiments; each replicate showed a similar epigenetic profile. LTR sequences are shaded in orange. LTR reads were randomly mapped to the 5′ LTR or 3′ LTR, because their sequences are identical. Peaks of each signal were analyzed by the model-based analysis of ChIP-seq algorithm and are shown as black bars above the histogram. The significance of enrichment of each signal over input-DNA peaks was calculated with a cutoff P value of 10−5. The ChIP-seq profile of the flanking human genome is shown at a larger scale (∼100 kb) in Fig. S5.

