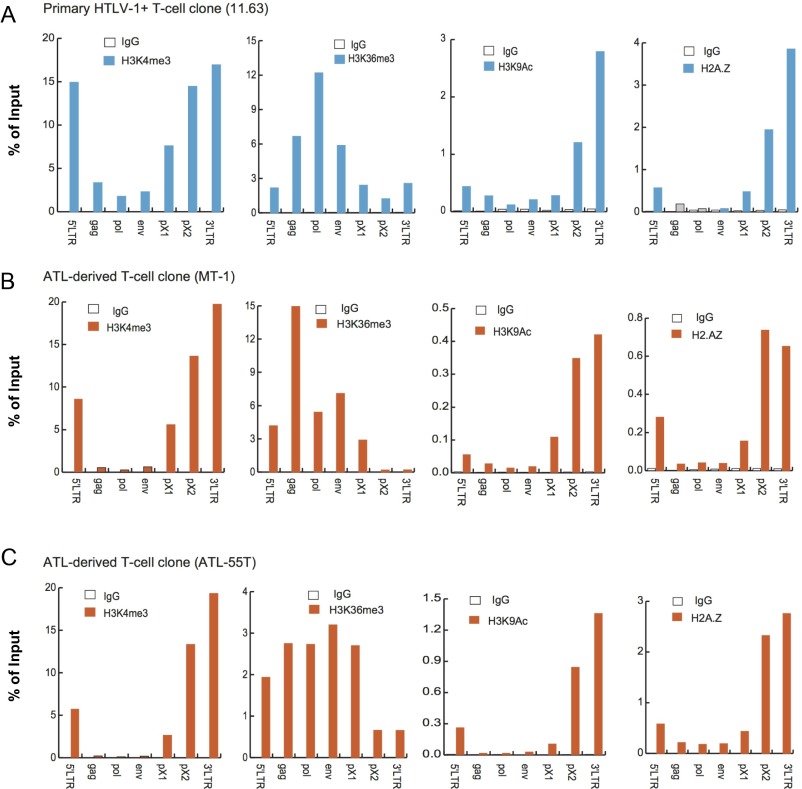
Fig. S2.
Epigenetic border at the proviral CTCF-BS in three additional HTLV-1–associated T-cell lines. ChIP signals of H3K4me3, H3K36me3, H3K9Ac, and H2A.Z over HTLV-1 provirus in a nonmalignant T-cell clone, 11.63 (A), and two ATL cell lines, MT-1 (B) and ATL-55T (C), are shown as the percentage of input DNA. Immunoprecipitated DNA was analyzed by real-time PCR using the primer sets shown in Fig. 1A. An IgG of unrelated specificity was used as a negative control. Representative results from three independent experiments are shown.

