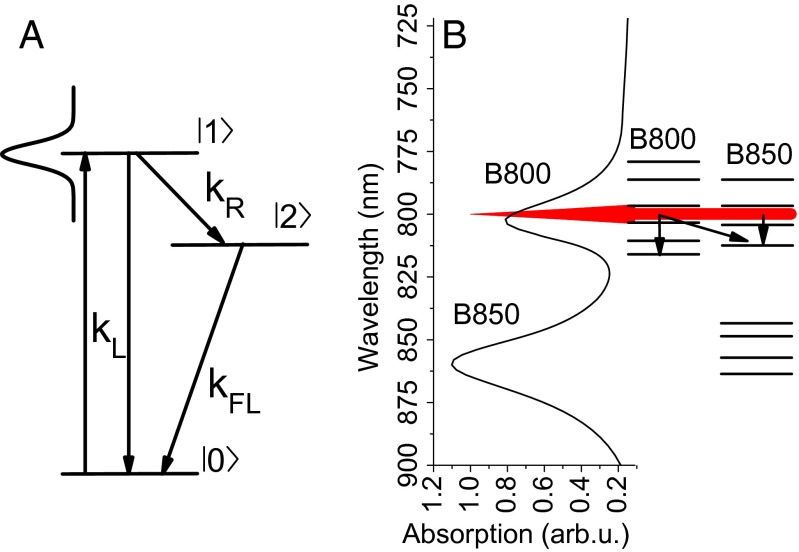
Fig. 1.
(A) The three-level scheme used for the data analysis. is the absorption and stimulated emission rate, is the spontaneous emission rate, and is the relaxation rate that is measured. The Gaussian profile represents the laser pulse, resonant with state and off-resonant with state . (B) Excited states available in LH2, schematically shown together with a measured absorption spectrum. The red peak represents the excitation spectrum at 800 nm; the arrows indicate possible relaxation channels.

