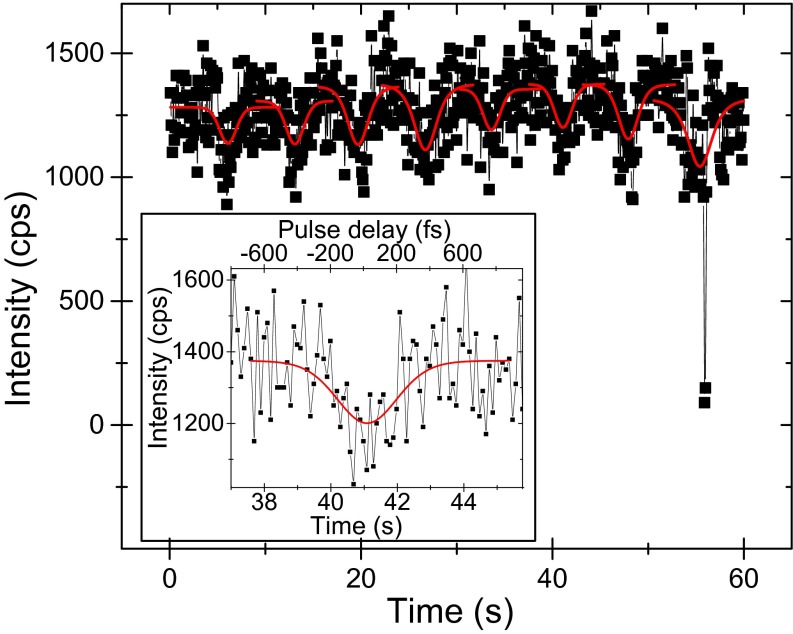
Fig. 2.
First 1 min of a measured fluorescence intensity trace of a single LH2 complex, recorded while continuously scanning the delay between the two excitation pulses. Red lines: data fitted with the three-level model in Fig. 1A. At t = 55 s, the complex briefly switches to a dark state (“blinking”). (Inset) Magnification of one intensity dip with a fitted relaxation time of . The bottom axis gives the real recording time, whereas the top axis denotes the delay between the two pulses.

