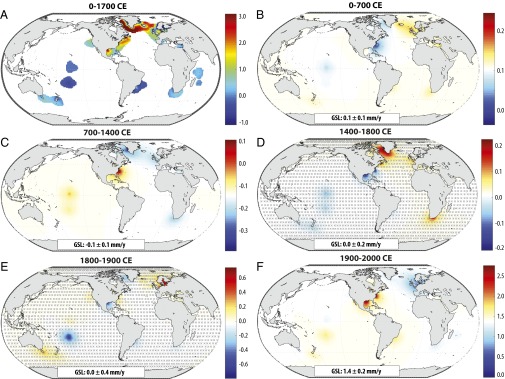
Fig. 2.
(A) Mean estimated rate of change (millimeters per year) over 0–1700 CE under prior ML2,1. In shaded areas, conditioning on the observations reduces the variance by at least 10% relative to the prior. (B−F) Mean estimated rates of change (mm/y) from (B) 0–700 CE, (C) 700–1400 CE, (D) 1400–1800 CE, (E) 1800–1900 CE, and (F) 1900–2000 CE, after removing the 0–1700 CE trend. Areas where a rise and a fall are about equally likely ( 0.33–0.67) are crosshatched. The color scales are centered around the noted rate of GSL change.

