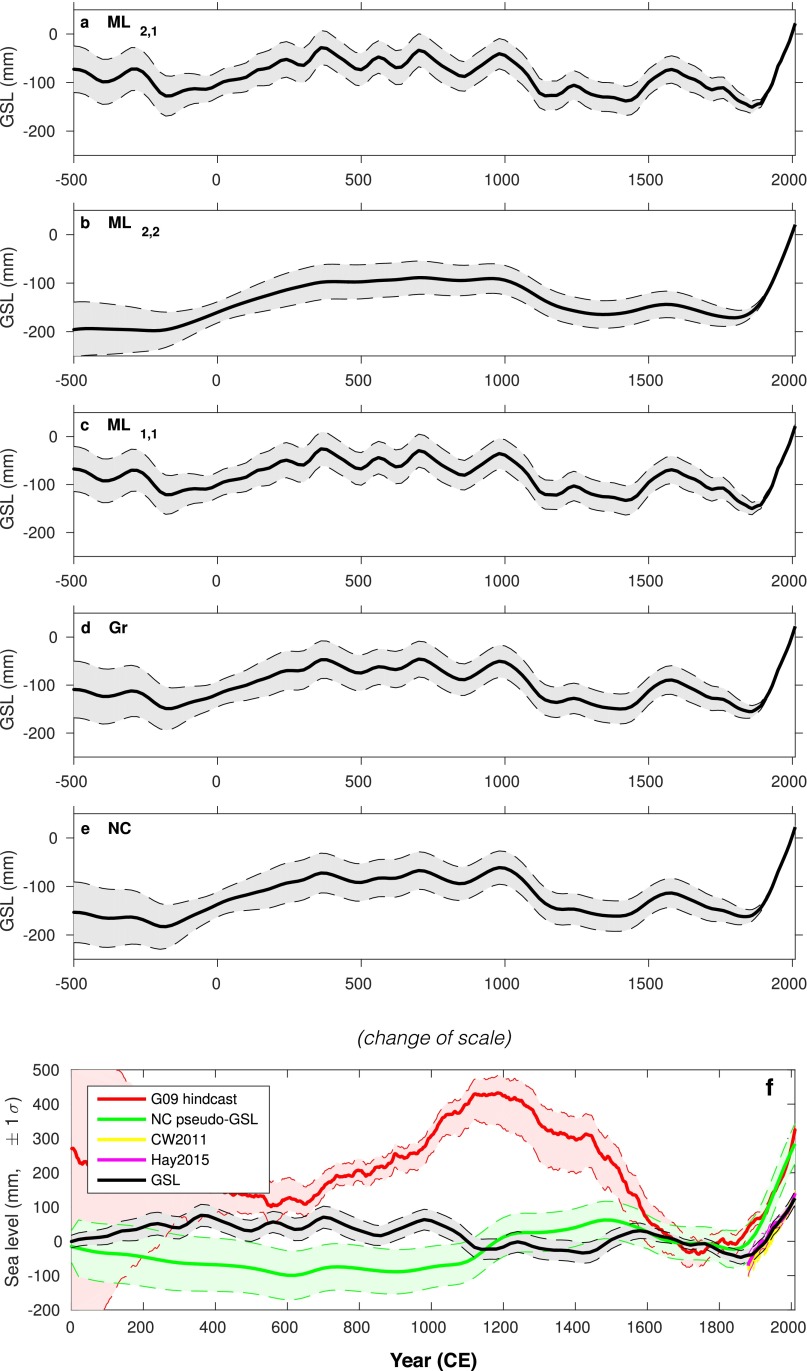
Fig. S3.
(A–E) GSL estimates under priors (A) ML2,1, (B) ML2,2, (C) ML1,1, (D) Gr, and (E) NC. (F) GSL reconstruction under prior ML2,1 (black) compared with the hindcast of ref. 20 (G09 hindcast; red), a curve derived from the North Carolina RSL curve by detrending and the addition of mm () errors after ref. 5 (NC pseudo-GSL; green), and the 19th–20th century GMSL reconstructions of ref. 12 (Hay2015; magenta) and ref. 106 (CW2011; yellow). Multicentury records are aligned relative to the 1600–1800 CE average; 19th–20th century reconstructions are aligned to match our GSL reconstruction in 2000 CE. Errors are .

