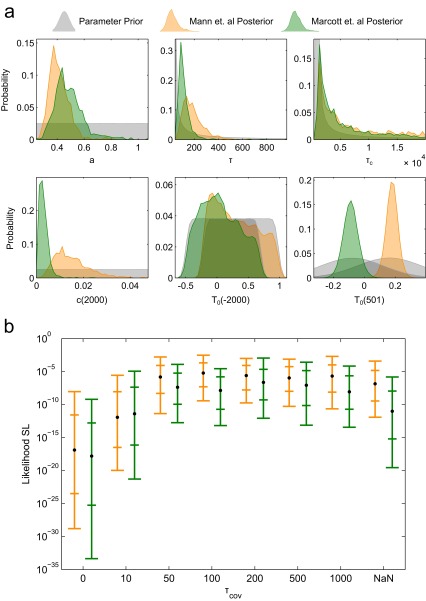
Fig. S5.
(A) Probability distributions of semiempirical model parameters. Prior distributions (gray) are not shown in full where scaling axes to display them would render posteriors obscure. (B) Likelihood of different values of . Black dots show likelihoods across all semiempirical projections, and the bars show the 5th/17th/83rd/95th percentile conditional likelihoods for individual semiempirical projections. A value of y is used in the analysis. Orange [green] represents calibration with the Mann et al. (1) [Marcott et al. (2)] temperature curve.

