Fig. 1.
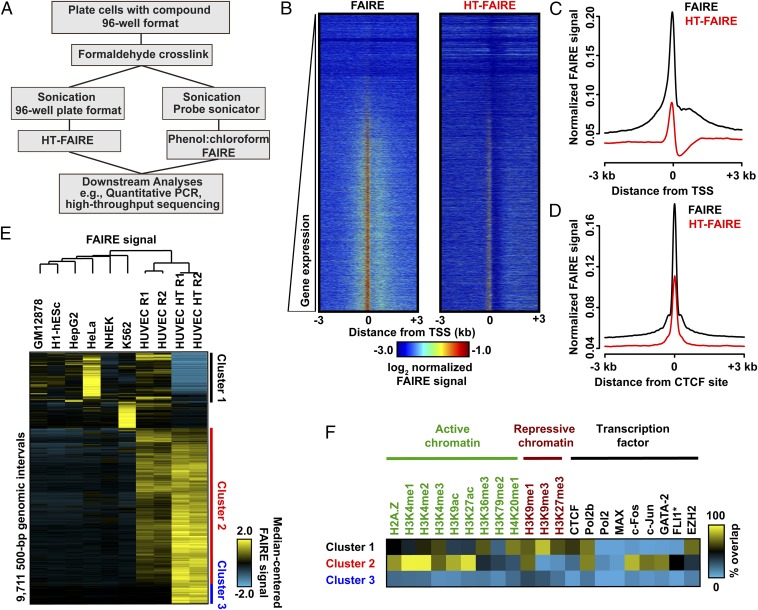
Comparison of FAIRE methodologies. (A) Flow diagram comparing column-based and standard FAIRE methods. (B) Heatmap representation of normalized FAIRE enrichment (±3 kb from TSS) using standard (Left) or column (Right) FAIRE in HUVEC. (C) Normalized FAIRE signal from both methods ±3 kb from TSS. (D) Normalized FAIRE signal from both methods ±3 kb around HUVEC CTCF sites (ENCODE). (E) Hierarchical clustering analysis of 500-bp intervals demonstrating differential FAIRE signals across seven cell types, as well as HUVEC HT-FAIRE. Platform-specific (clusters 1 and 3) and cell type-specific (cluster 2) clusters were identified. (F) Fractional overlap annotation of clusters 1–3, with histone modifications and transcription factors (ENCODE).

