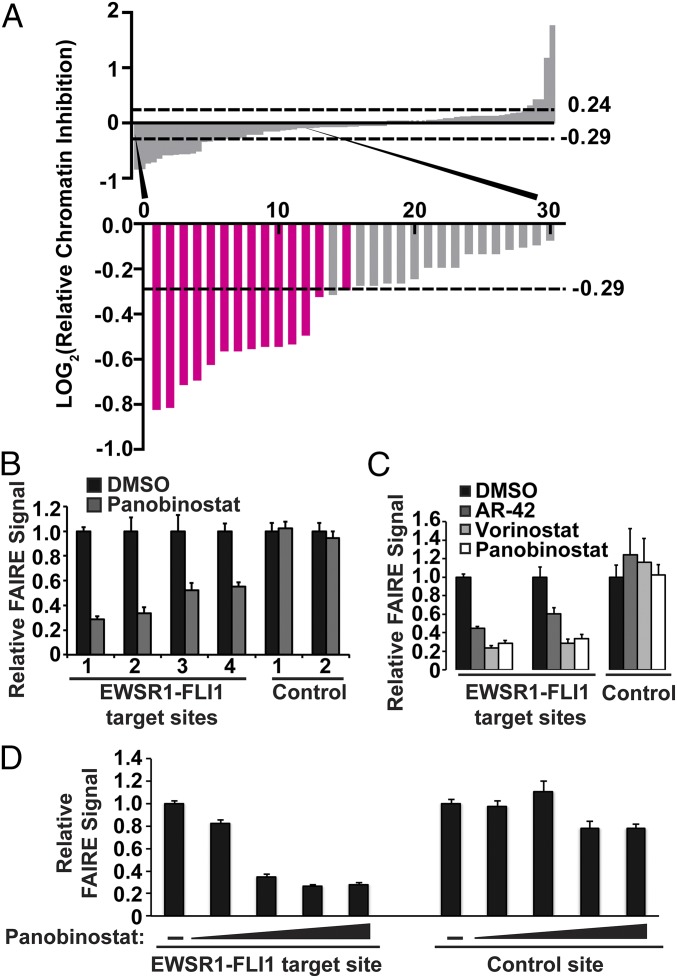
Fig. 3.
HDAC inhibitors affect EWSR1-FLI1 chromatin accessibility in a dose-dependent manner. (A) Secondary screen that included all hit compounds from plate 1 and plate 2 and a selection of compounds that did not score. LOG2 ratio of the RCI values as described for Fig. 2 C and D. The dashed lines indicate the significance cutoff of RCI values ≥3 SDs or ≤3 SDs from the average RCI for vehicle-treated controls. The bars representing HDAC inhibitors are highlighted in magenta. (B) Standard FAIRE-qPCR was performed on EWS894 cells treated with Panobinostat for EWSR1-FLI1 target sites (1, P1; 2, P7; 3, target 3; 4, target 4) (Table S3) and control sites (1, AURKAIP1; 2, control 2) (Table S3). (C) Standard FAIRE-qPCR (target sites P1, P7; control site AURKAIP1) was performed on EWS894 cells treated with Vorinostat, AR-42, or Panobinostat. (D) FAIRE-qPCR was performed on an EWSR1-FLI1 binding site (P1) and a control site (AURKAIP1) after treatment of EWS894 cells with DMSO or 10-fold dilutions of Panobinostat (10 μM to 0.01 μM). All treatments were 10 µM for 16 h unless otherwise noted. FAIRE is plotted relative to DMSO control, and error bars represent the SD of three replicates.

