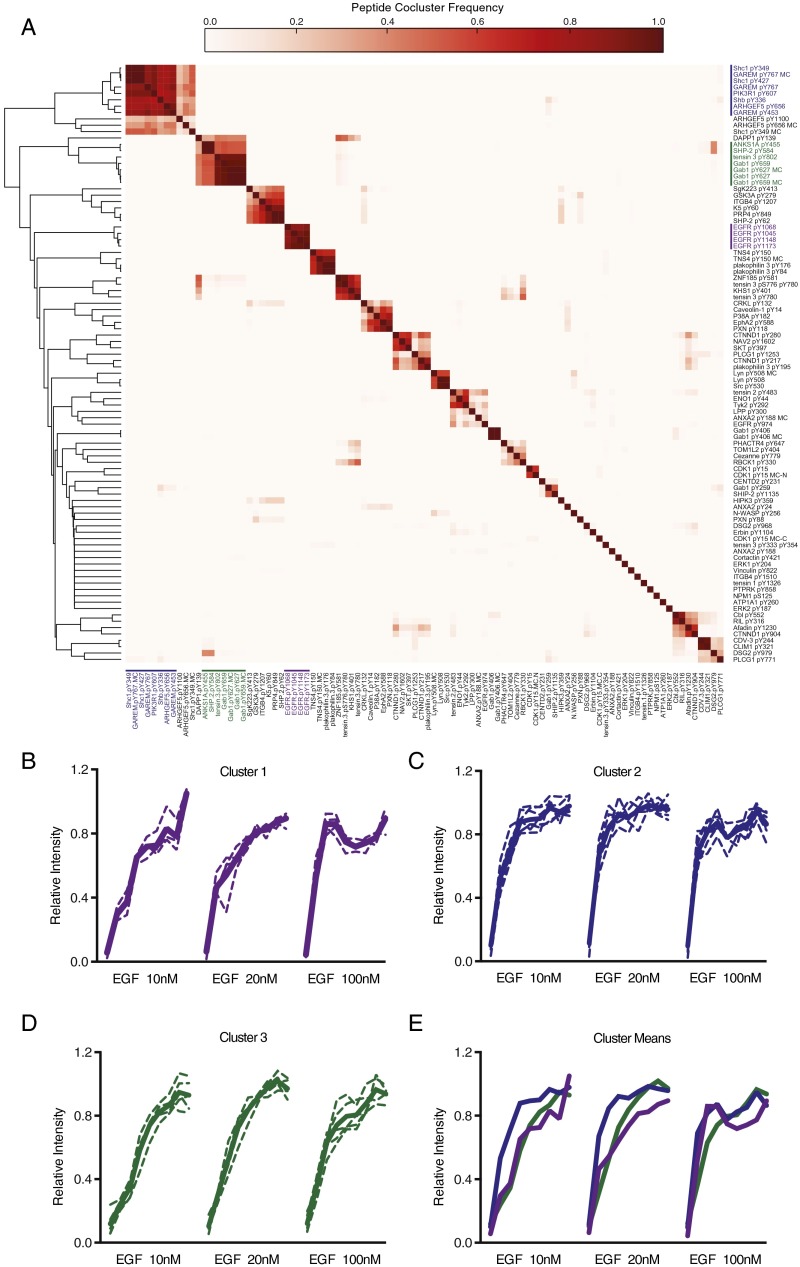
Fig. S3.
SOM clustering analysis of EGF stimulated phosphopeptides. (A) Heat map showing frequency with which individual peptides appeared in the same cluster in 10,000 iterations of SOM clustering. Peptide clustering behaviors sorted by Pearson correlation. Individual clusters included (B) EGFR pY1045, EGFR pY1068, EGFR pY1148, EGFR pY1173; (C) Shc pY239, Shc pY317, GAREM pY453, GAREM pY767, PI3KR1 pY607, Arhgef5 pY656, Shb pY336; and (D) Gab1 pY627, Gab1 pY659, Tensin 3 pY802, ANKS1A pY455, SHP2 pY584. Individual dynamics plotted as dashed lines; cluster means plotted as solid lines. (E) Mean dynamics of clusters 1–3 plotted together.

