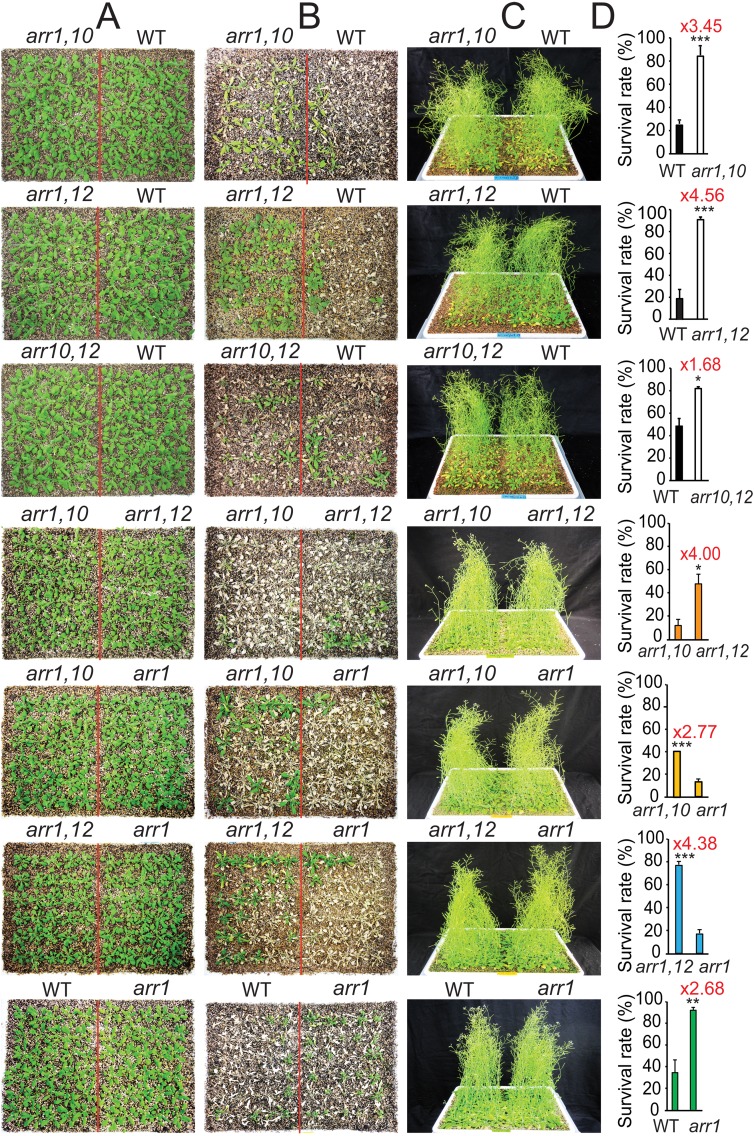
Fig. S4.
Comparison of drought tolerance of arr1,10, arr1,12, and arr10,12 double, arr1 single mutant, and WT plants. (A) Two-week-old arr1,10, arr1,12, arr10,12, arr1, and WT plants were transferred from GM plates to soil and grown for an additional week. (B) Three-week-old plants were exposed to a drought treatment by water withholding and then rewatered for 3 d. Photographs were taken subsequent to rewatering and after the removal of inflorescences. (C) For control purposes, 2-wk-old arr and WT plants were transferred from GM plates to trays and grown under well-watered control conditions in parallel with the drought tolerance test as shown in A. (D) Survival rates and SEs (error bars) were calculated from the results of three independent experiments (n = 30 plants per genotype). Asterisks indicate significant differences as determined by a Student’s t test analysis (*P < 0.05; **P < 0.01; ***P < 0.001). Red numbers above the asterisks represent the fold-change over the WT or arr1 or arr1,10.

