Fig. S5.
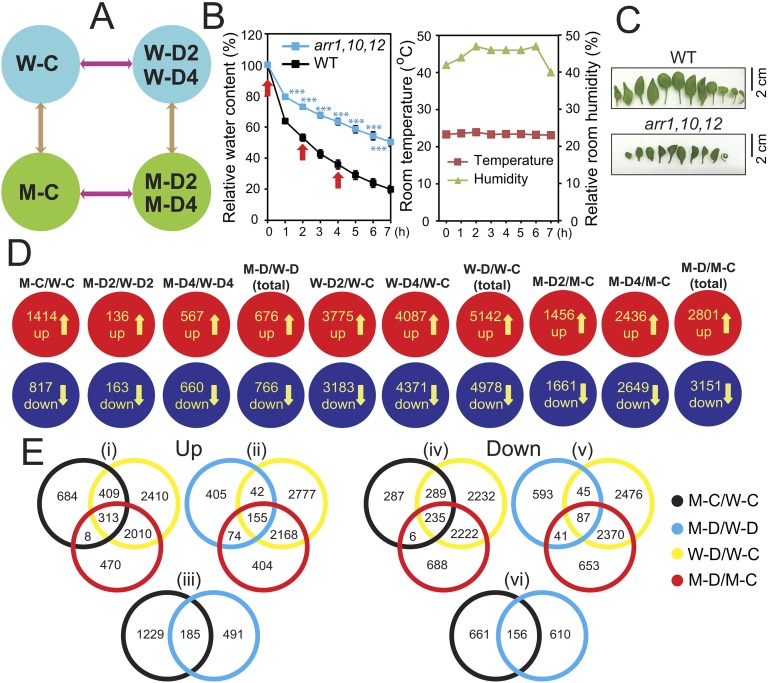
Illustration of experimental design and summary of the results of the microarray analysis. (A) Diagrams showing experimental design and all relevant comparisons (arrows). (B) RWC of aerial portions of the 24-d-old Arabidopsis response regulator arr1,10,12 and WT plants exposed to a dehydration treatment. Data represent the means and SEs (n = 5). Asterisks indicate significant differences as determined by a Student's t test (***P < 0.001). Rosette leaf samples collected at 0, 2, and 4 h (arrows) were used for transcriptome analysis. Room temperature and relative room humidity were recorded during the dehydration treatment. (C) Detached representative leaves from well-watered WT and arr1,10,12 plants. (D) Diagrams showing up- and down-regulated genes by dehydration treatment identified in each genotype. (E) Venn diagrams showing the overlapping and nonoverlapping up- and down-regulated genes among the major DEG sets. Data were obtained from the results of microarray analyses of three biological repeats. W-C, WT well-watered control; W-D2, WT dehydrated 2 h; W-D4, WT dehydrated 4 h; M-C, arr1,10,12 well-watered control; M-D2, arr1,10,12 dehydrated 2 h; M -D4, arr1,10,12 dehydrated 4 h. M-D/W-D represents M-D2/W-D2 and/or M-D4/W-D4; W-D/W-C represents W-D2/W-C and/or W-D4/W-C; M-D/M-C represents M-D2/M-C and/or M-D4/M-C.

